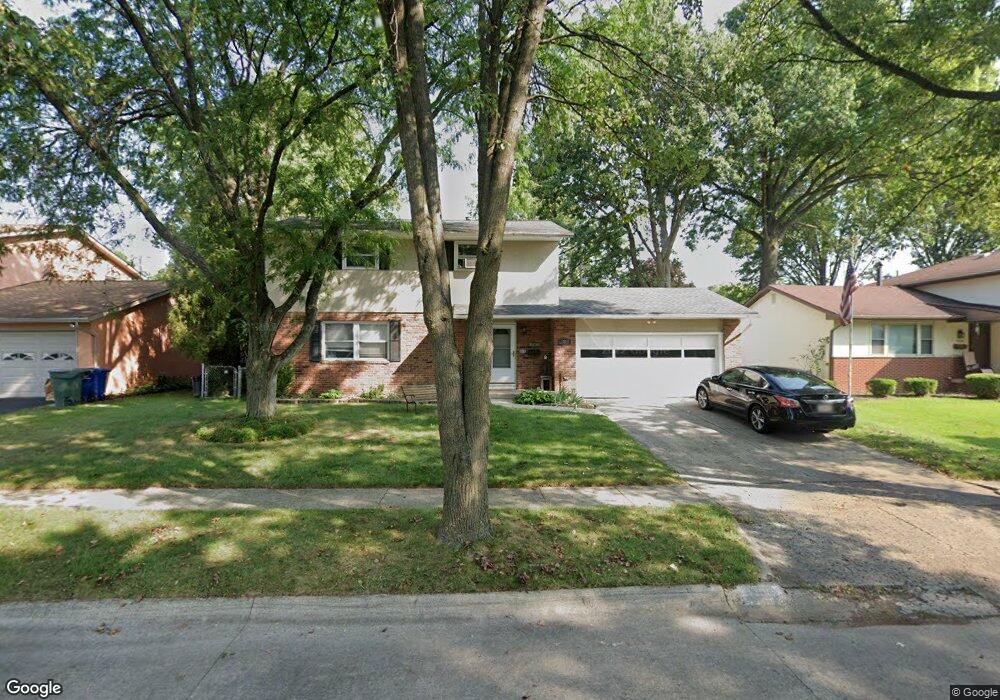
1288 Bosworth Square S Columbus, OH 43229
Devonshire NeighborhoodEstimated Value: $293,000 - $318,000
4
Beds
3
Baths
2,048
Sq Ft
$150/Sq Ft
Est. Value
About This Home
This home is located at 1288 Bosworth Square S, Columbus, OH 43229 and is currently estimated at $307,876, approximately $150 per square foot. 1288 Bosworth Square S is a home located in Franklin County with nearby schools including Devonshire Alternative Elementary School, Woodward Park Middle School, and Beechcroft High School.
Ownership History
Date
Name
Owned For
Owner Type
Purchase Details
Closed on
Aug 15, 2003
Sold by
Fagan John and Fagan Cathy
Bought by
Fagan John
Current Estimated Value
Home Financials for this Owner
Home Financials are based on the most recent Mortgage that was taken out on this home.
Original Mortgage
$116,000
Outstanding Balance
$53,711
Interest Rate
6.33%
Mortgage Type
Purchase Money Mortgage
Estimated Equity
$254,165
Purchase Details
Closed on
May 18, 2000
Sold by
Roth Marcus W and Roth Sheila V
Bought by
Fagan John and Fagan Cathy
Home Financials for this Owner
Home Financials are based on the most recent Mortgage that was taken out on this home.
Original Mortgage
$96,000
Interest Rate
8.18%
Purchase Details
Closed on
Feb 29, 1996
Sold by
Michalak Frank J
Bought by
Roth Marcus W and Roth Sheila V
Home Financials for this Owner
Home Financials are based on the most recent Mortgage that was taken out on this home.
Original Mortgage
$88,517
Interest Rate
7.07%
Mortgage Type
FHA
Purchase Details
Closed on
Aug 1, 1984
Create a Home Valuation Report for This Property
The Home Valuation Report is an in-depth analysis detailing your home's value as well as a comparison with similar homes in the area
Home Values in the Area
Average Home Value in this Area
Purchase History
| Date | Buyer | Sale Price | Title Company |
|---|---|---|---|
| Fagan John | -- | -- | |
| Fagan John | -- | -- | |
| Fagan John | $120,000 | Capital Title | |
| Roth Marcus W | $89,000 | -- | |
| -- | $59,000 | -- |
Source: Public Records
Mortgage History
| Date | Status | Borrower | Loan Amount |
|---|---|---|---|
| Open | Fagan John | $116,000 | |
| Closed | Fagan John | $96,000 | |
| Closed | Roth Marcus W | $88,517 |
Source: Public Records
Tax History Compared to Growth
Tax History
| Year | Tax Paid | Tax Assessment Tax Assessment Total Assessment is a certain percentage of the fair market value that is determined by local assessors to be the total taxable value of land and additions on the property. | Land | Improvement |
|---|---|---|---|---|
| 2024 | $4,244 | $94,570 | $17,850 | $76,720 |
| 2023 | $4,190 | $94,570 | $17,850 | $76,720 |
| 2022 | $2,832 | $54,600 | $13,650 | $40,950 |
| 2021 | $2,837 | $54,600 | $13,650 | $40,950 |
| 2020 | $2,841 | $54,600 | $13,650 | $40,950 |
| 2019 | $2,559 | $42,180 | $10,920 | $31,260 |
| 2018 | $2,427 | $42,180 | $10,920 | $31,260 |
| 2017 | $2,557 | $42,180 | $10,920 | $31,260 |
| 2016 | $2,534 | $38,260 | $8,300 | $29,960 |
| 2015 | $2,301 | $38,260 | $8,300 | $29,960 |
| 2014 | $2,306 | $38,260 | $8,300 | $29,960 |
| 2013 | $1,264 | $42,490 | $9,205 | $33,285 |
Source: Public Records
Map
Nearby Homes
- 1294 Clydesdale Ct
- 1409 Bosworth Place
- 1322 Bolenhill Ct
- 1421 Bosworth Place
- 1268 Kildale Ct
- 6407 Faircrest Rd
- 6458 Faircrest Rd
- 1635 Tendril Ct
- 1288 Oakfield Dr N
- 6342 Bellmeadow Dr
- 6189 Northgap Dr
- 6211 Parkdale Dr
- 1549 Alpine Dr
- 6407 Skywae Dr
- 1171 Newbury Dr
- 1755 Hillandale Ave
- 6035 Karl Rd
- 5990 Ambleside Dr
- 6355 Johnanne St
- 6496 Hearthstone Ave
- 1296 Bosworth Square S
- 1280 Bosworth Square S
- 1285 Bosworth Square N
- 1293 Bosworth Square N
- 1304 Bosworth Square S
- 1272 Bosworth Square S
- 6590 Bosworth Square W
- 1301 Bosworth Square N
- 1291 Bosworth Square S
- 1287 Bosworth Square S
- 1299 Bosworth Square S
- 1312 Bosworth Square S
- 1277 Bosworth Square S
- 1313 Bosworth Square N
- 1305 Bosworth Square S
- 1271 Bosworth Square S
- 1320 Bosworth Square S
- 1311 Bosworth Square S
- 1321 Bosworth Square N
- 6585 Bosworth Square W