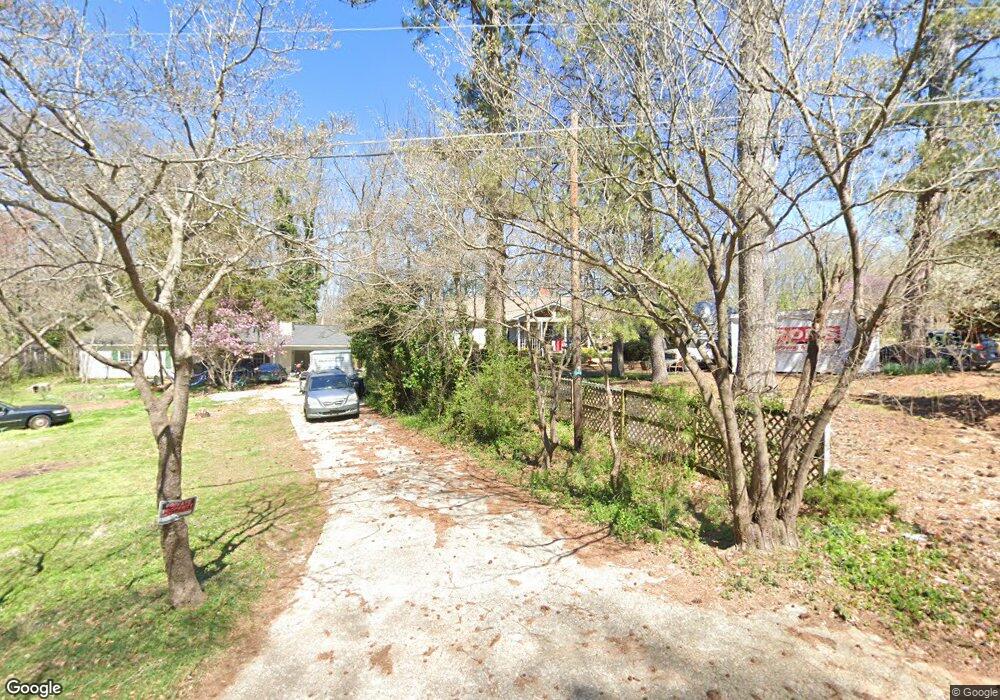
1288 Center St SW Mableton, GA 30126
Estimated Value: $245,939 - $295,000
3
Beds
1
Bath
1,506
Sq Ft
$180/Sq Ft
Est. Value
About This Home
This home is located at 1288 Center St SW, Mableton, GA 30126 and is currently estimated at $270,985, approximately $179 per square foot. 1288 Center St SW is a home located in Cobb County with nearby schools including Deerwood Elementary School, Mableton Elementary School, and Floyd Middle School.
Ownership History
Date
Name
Owned For
Owner Type
Purchase Details
Closed on
Jan 12, 2015
Sold by
Serredell Robert J
Bought by
Serredell Robert J
Current Estimated Value
Home Financials for this Owner
Home Financials are based on the most recent Mortgage that was taken out on this home.
Original Mortgage
$95,136
Outstanding Balance
$74,142
Interest Rate
4.4%
Mortgage Type
FHA
Estimated Equity
$196,843
Purchase Details
Closed on
Apr 12, 2013
Sold by
Powderly Michael J
Bought by
Powderly Michael J and Morris James Richard
Purchase Details
Closed on
Oct 23, 2007
Sold by
Smith Helen Grace
Bought by
Powderly Michael J and Powderly Gwendolyn M
Purchase Details
Closed on
May 1, 2002
Sold by
Starkey Dorothy K
Bought by
Starkey Andrew M
Purchase Details
Closed on
Oct 10, 1997
Sold by
Arey Edwin A
Bought by
Starkey Andrew and Starkey Dorothy
Home Financials for this Owner
Home Financials are based on the most recent Mortgage that was taken out on this home.
Original Mortgage
$57,400
Interest Rate
7.39%
Mortgage Type
FHA
Create a Home Valuation Report for This Property
The Home Valuation Report is an in-depth analysis detailing your home's value as well as a comparison with similar homes in the area
Home Values in the Area
Average Home Value in this Area
Purchase History
| Date | Buyer | Sale Price | Title Company |
|---|---|---|---|
| Serredell Robert J | -- | -- | |
| Powderly Michael J | $105,000 | -- | |
| Powderly Michael J | $100,000 | -- | |
| Starkey Andrew M | -- | -- | |
| Starkey Andrew | $45,000 | -- |
Source: Public Records
Mortgage History
| Date | Status | Borrower | Loan Amount |
|---|---|---|---|
| Open | Serredell Robert J | $95,136 | |
| Previous Owner | Starkey Andrew | $57,400 |
Source: Public Records
Tax History Compared to Growth
Tax History
| Year | Tax Paid | Tax Assessment Tax Assessment Total Assessment is a certain percentage of the fair market value that is determined by local assessors to be the total taxable value of land and additions on the property. | Land | Improvement |
|---|---|---|---|---|
| 2025 | $358 | $88,608 | $33,060 | $55,548 |
| 2024 | $360 | $88,608 | $33,060 | $55,548 |
| 2023 | $180 | $78,240 | $33,060 | $45,180 |
| 2022 | $268 | $57,912 | $20,880 | $37,032 |
| 2021 | $242 | $49,192 | $18,096 | $31,096 |
| 2020 | $229 | $45,016 | $13,920 | $31,096 |
| 2019 | $229 | $45,016 | $13,920 | $31,096 |
| 2018 | $204 | $36,720 | $8,004 | $28,716 |
| 2017 | $158 | $26,756 | $5,220 | $21,536 |
| 2016 | $160 | $26,756 | $5,220 | $21,536 |
| 2015 | $171 | $26,452 | $3,480 | $22,972 |
| 2014 | $165 | $23,760 | $0 | $0 |
Source: Public Records
Map
Nearby Homes
- 1275 Clay Rd SW
- 5527 Andrew Dr SW
- 5531 Wild Cherry Dr SW
- 4397 Treadle Rd SW
- 1056 Retner Dr SW Unit 3
- 5393 Janet Ln
- 1047 Retner Dr SW
- 5615 Hislop Ln Unit 82
- 4976 Mable Lake Dr SW
- 1440 Compton Dr SW
- 0 Brookwood Dr Unit 7577066
- 0 Brookwood Dr Unit 10519191
- 5205 Silhouette Ln SW
- 5320 Beth Dr
- 5590 Lakeview Dr SW
- 5410 Beth Dr
- 814 Glennferry Bend SW
- 1290 Center St SW
- 1270 Center St SW
- 1265 Mimosa Cir SW
- 5220 A B Mimosa Place SW
- 5208 Mimosa Place SW
- 1291 Center St SW
- 1320 Center St SW
- 1268 Mimosa Cir SW
- 1256 Center St SW
- 1275 Center St SW
- 5210 Mimosa Place SW
- 1315 Center St SW
- 1265 Center St SW
- 5211 Mimosa Place SW Unit 5213
- 1245 Mimosa Cir SW
- 1250 Mimosa Cir SW
- 5200 Mimosa Place SW
- 5200 Mimosa Place SW Unit ABC
- 1244 Center St SW
- 1328 Center St SW