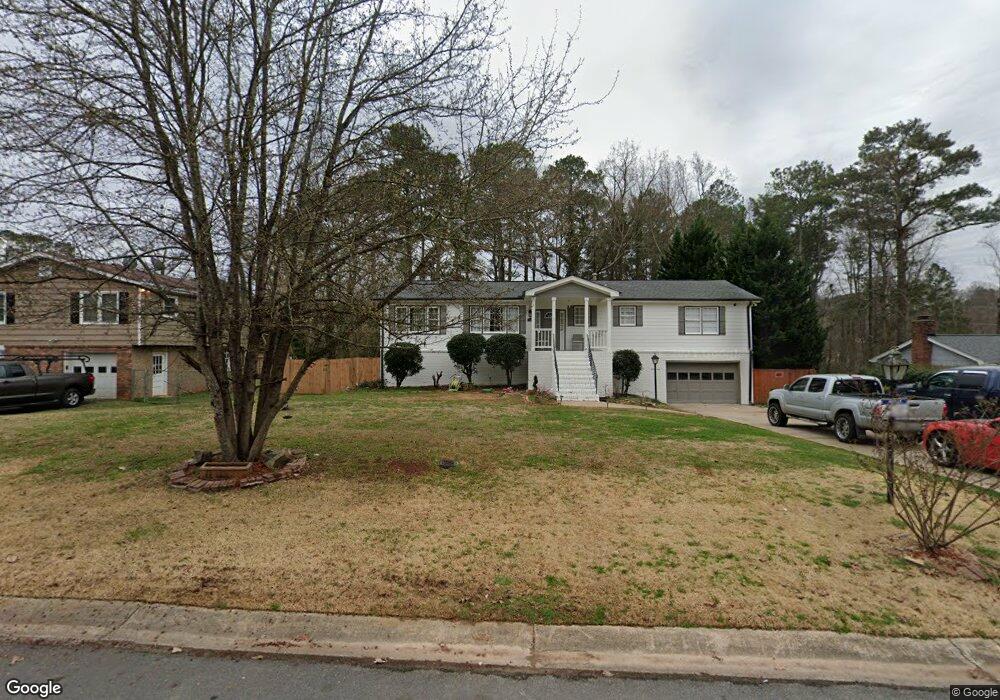
1288 Pine Creek Dr Unit A Woodstock, GA 30188
Sandy Plains NeighborhoodEstimated Value: $358,000 - $419,000
3
Beds
2
Baths
2,674
Sq Ft
$143/Sq Ft
Est. Value
About This Home
This home is located at 1288 Pine Creek Dr Unit A, Woodstock, GA 30188 and is currently estimated at $382,556, approximately $143 per square foot. 1288 Pine Creek Dr Unit A is a home located in Cobb County with nearby schools including Keheley Elementary School, McCleskey Middle School, and The Garden School.
Ownership History
Date
Name
Owned For
Owner Type
Purchase Details
Closed on
Dec 1, 2017
Sold by
Dominguez Coradi J
Bought by
Dominguez Coradi J and Mendez Walter
Current Estimated Value
Home Financials for this Owner
Home Financials are based on the most recent Mortgage that was taken out on this home.
Original Mortgage
$188,000
Outstanding Balance
$95,627
Interest Rate
3.94%
Mortgage Type
New Conventional
Estimated Equity
$286,929
Purchase Details
Closed on
Jun 12, 2014
Sold by
Casey Heather S
Bought by
Daswani Arun and Daswani Mamta
Purchase Details
Closed on
Aug 6, 2003
Sold by
O'Neal Myra I
Bought by
Casey Heather S
Home Financials for this Owner
Home Financials are based on the most recent Mortgage that was taken out on this home.
Original Mortgage
$137,837
Interest Rate
5.52%
Mortgage Type
FHA
Create a Home Valuation Report for This Property
The Home Valuation Report is an in-depth analysis detailing your home's value as well as a comparison with similar homes in the area
Home Values in the Area
Average Home Value in this Area
Purchase History
| Date | Buyer | Sale Price | Title Company |
|---|---|---|---|
| Dominguez Coradi J | -- | -- | |
| Dominguez Coradi J | $228,000 | -- | |
| Daswani Arun | $95,000 | -- | |
| Casey Heather S | $140,000 | -- |
Source: Public Records
Mortgage History
| Date | Status | Borrower | Loan Amount |
|---|---|---|---|
| Open | Dominguez Coradi J | $188,000 | |
| Closed | Dominguez Coradi J | $188,000 | |
| Previous Owner | Casey Heather S | $137,837 |
Source: Public Records
Tax History Compared to Growth
Tax History
| Year | Tax Paid | Tax Assessment Tax Assessment Total Assessment is a certain percentage of the fair market value that is determined by local assessors to be the total taxable value of land and additions on the property. | Land | Improvement |
|---|---|---|---|---|
| 2025 | $3,225 | $132,756 | $25,600 | $107,156 |
| 2024 | $3,227 | $132,756 | $25,600 | $107,156 |
| 2023 | $2,599 | $128,800 | $18,000 | $110,800 |
| 2022 | $3,165 | $128,800 | $18,000 | $110,800 |
| 2021 | $2,594 | $102,716 | $18,000 | $84,716 |
| 2020 | $2,245 | $86,744 | $14,000 | $72,744 |
| 2019 | $2,245 | $86,744 | $14,000 | $72,744 |
| 2018 | $1,948 | $73,212 | $14,000 | $59,212 |
| 2017 | $2,105 | $73,212 | $14,000 | $59,212 |
| 2016 | $1,301 | $45,260 | $8,000 | $37,260 |
| 2015 | $1,119 | $37,992 | $5,672 | $32,320 |
| 2014 | $1,194 | $40,172 | $0 | $0 |
Source: Public Records
Map
Nearby Homes
- 1244 Hickory Wood Dr NE
- 421 Creek Valley Dr
- 615 Bedford Ct
- 201 Jonquil Spring Rd
- 1351 Yorkshire Ln
- 204 Magnolia Creek Way
- 4855 Rockford Ridge Dr
- 4816 Olde Mill Dr
- 4941 Willow Ln
- 0 Highway 92 Unit 7661901
- 2899 Treeside Terrace
- 139 Village Trail
- 532 Walton Dr
- 226 Hames Rd Unit 405
- 226 Hames Rd Unit 225
- 338 Cherryhill Ln
- 540 Stockwood Dr
- 179 Village Trail
- 403 Village View
- 156 W Oaks Place
- 1288 Pine Creek Dr
- 1288 Pine Creek Dr Unit B
- 1300 Pine Creek Dr
- 1276 Pine Creek Dr
- 1287 Pine Creek Dr
- 1299 Pine Creek Dr
- 1291 Hickory Wood Dr NE
- 1263 Pine Creek Dr
- 5210 Twin Oak Dr NE
- 5200 Twin Oak Dr NE
- 5190 Twin Oak Dr NE
- 5220 Twin Oak Dr NE
- 5180 Twin Oak Dr NE
- 5230 Twin Oak Dr NE
- 1240 Pine Creek Dr
- 5363 Olde Mill Dr NE
- 5375 Olde Mill Dr NE
- 5170 Twin Oak Dr NE
- 5315 Olde Mill Dr NE
- 5351 Olde Mill Dr NE Unit IV