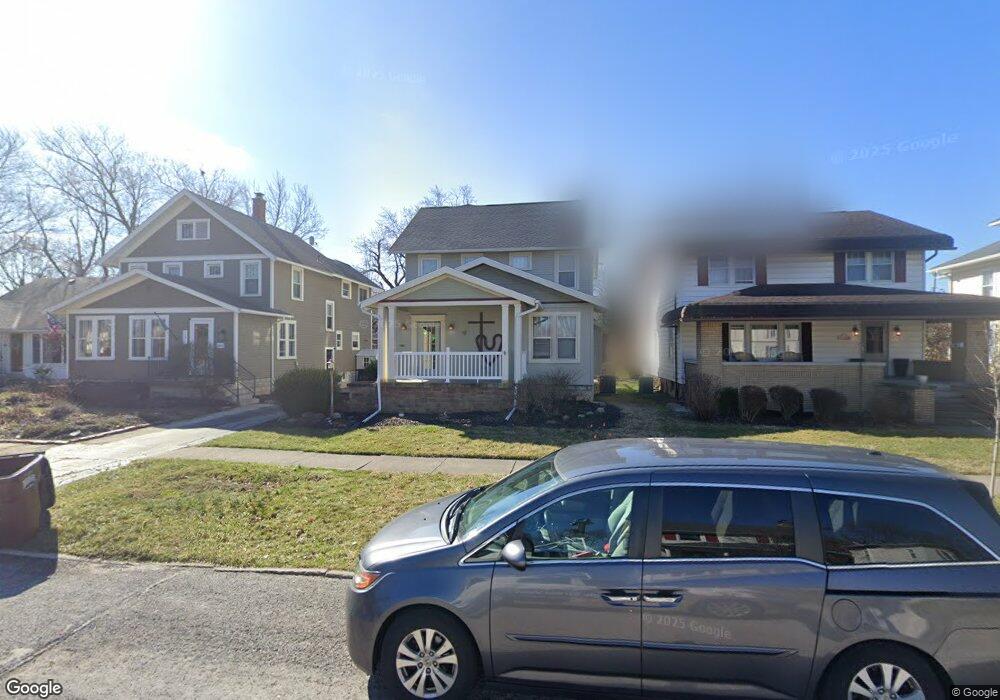
129 3rd St Findlay, OH 45840
Estimated Value: $234,000 - $269,000
4
Beds
3
Baths
1,921
Sq Ft
$132/Sq Ft
Est. Value
About This Home
This home is located at 129 3rd St, Findlay, OH 45840 and is currently estimated at $253,319, approximately $131 per square foot. 129 3rd St is a home located in Hancock County with nearby schools including Jefferson Elementary School, Chamberlin Hill Elementary School, and Donnell Middle School.
Ownership History
Date
Name
Owned For
Owner Type
Purchase Details
Closed on
Jan 28, 2016
Bought by
Weitz Crystal M and Weitz Craig D
Current Estimated Value
Home Financials for this Owner
Home Financials are based on the most recent Mortgage that was taken out on this home.
Interest Rate
3.79%
Purchase Details
Closed on
Apr 16, 1996
Sold by
Yokas William
Bought by
Buskey Frederick and Buskey Pamela
Home Financials for this Owner
Home Financials are based on the most recent Mortgage that was taken out on this home.
Original Mortgage
$88,000
Interest Rate
7.46%
Mortgage Type
Balloon
Purchase Details
Closed on
Apr 15, 1994
Bought by
Yokas William H
Purchase Details
Closed on
Mar 15, 1993
Bought by
Newton Robert E and Newton Jennifer
Purchase Details
Closed on
Feb 15, 1989
Bought by
Yates Dean J and Yates Joyce C
Purchase Details
Closed on
Nov 23, 1987
Bought by
Yates Dean J and Yates Joyce C
Create a Home Valuation Report for This Property
The Home Valuation Report is an in-depth analysis detailing your home's value as well as a comparison with similar homes in the area
Home Values in the Area
Average Home Value in this Area
Purchase History
| Date | Buyer | Sale Price | Title Company |
|---|---|---|---|
| Weitz Crystal M | $104,000 | -- | |
| Buskey Frederick | $110,000 | -- | |
| Yokas William H | $104,000 | -- | |
| Newton Robert E | $92,500 | -- | |
| Yates Dean J | -- | -- | |
| Yates Dean J | $68,900 | -- |
Source: Public Records
Mortgage History
| Date | Status | Borrower | Loan Amount |
|---|---|---|---|
| Closed | Weitz Crystal M | -- | |
| Previous Owner | Buskey Frederick | $88,000 |
Source: Public Records
Tax History
| Year | Tax Paid | Tax Assessment Tax Assessment Total Assessment is a certain percentage of the fair market value that is determined by local assessors to be the total taxable value of land and additions on the property. | Land | Improvement |
|---|---|---|---|---|
| 2024 | $2,599 | $73,170 | $7,760 | $65,410 |
| 2023 | $2,603 | $73,170 | $7,760 | $65,410 |
| 2022 | $2,594 | $73,170 | $7,760 | $65,410 |
| 2021 | $2,734 | $67,160 | $7,970 | $59,190 |
| 2020 | $2,733 | $67,160 | $7,970 | $59,190 |
| 2019 | $2,678 | $67,160 | $7,970 | $59,190 |
| 2018 | $2,363 | $54,330 | $4,980 | $49,350 |
| 2017 | $2,362 | $54,330 | $4,980 | $49,350 |
| 2016 | $2,327 | $54,330 | $4,980 | $49,350 |
| 2015 | $1,536 | $35,130 | $4,980 | $30,150 |
| 2014 | $1,536 | $35,130 | $4,980 | $30,150 |
| 2012 | $1,549 | $35,130 | $4,980 | $30,150 |
Source: Public Records
Map
Nearby Homes
- 123 Glendale Ave
- 206 Greenlawn Ave
- 216 1st St
- 1304 Douglas Pkwy
- 865 S Main St
- 324 W Mcpherson Ave
- 1113 Hurd Ave
- 829 Maple Ave
- 423 Elm St
- 315 Fairlawn Place
- 331 Fairlawn Place
- 412 Lima Ave
- 416 1/2 Lima Ave
- 731 5th St
- 860 Hurd Ave
- 845 Hurd Ave
- 136 E Hobart Ave
- 514 Liberty St
- 209 E Hobart Ave
- 527 W Sandusky St
Your Personal Tour Guide
Ask me questions while you tour the home.