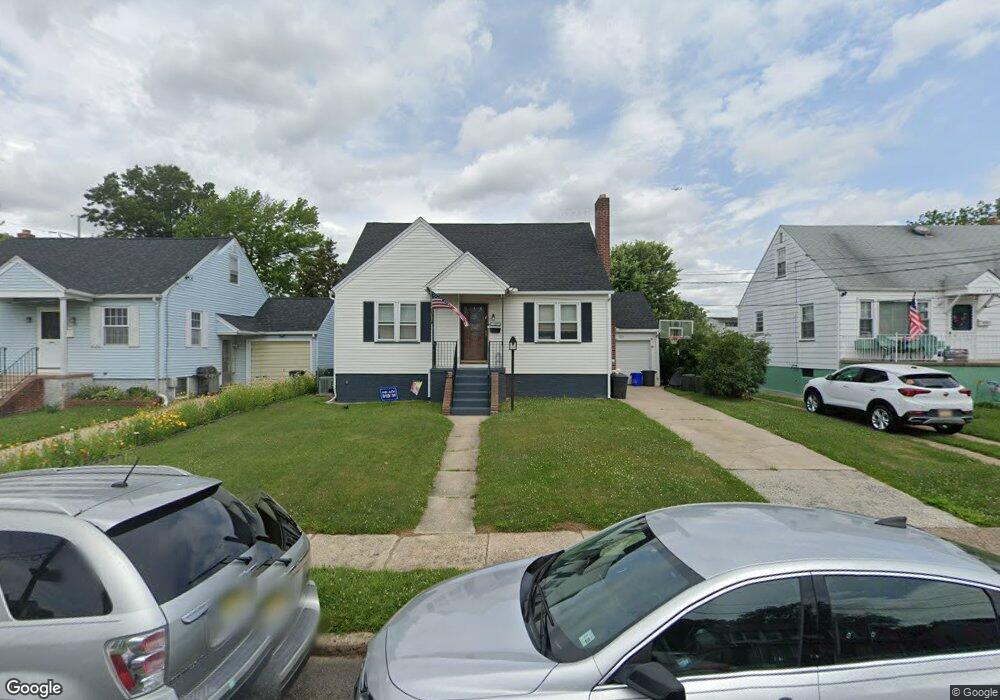
129 8th Ave Mount Ephraim, NJ 08059
Estimated Value: $293,924 - $323,000
--
Bed
--
Bath
1,229
Sq Ft
$251/Sq Ft
Est. Value
About This Home
This home is located at 129 8th Ave, Mount Ephraim, NJ 08059 and is currently estimated at $308,481, approximately $251 per square foot. 129 8th Ave is a home located in Camden County with nearby schools including Mary Bray Elementary School, Raymond W. Kershaw Elementary School, and Brookfield Elementary School.
Ownership History
Date
Name
Owned For
Owner Type
Purchase Details
Closed on
Apr 17, 2024
Sold by
Jusiak Paul
Bought by
Jusiak Paul and Jusiak Stephanie
Current Estimated Value
Home Financials for this Owner
Home Financials are based on the most recent Mortgage that was taken out on this home.
Original Mortgage
$163,614
Outstanding Balance
$161,165
Interest Rate
6.87%
Mortgage Type
FHA
Estimated Equity
$147,316
Purchase Details
Closed on
Feb 27, 2004
Sold by
Morley Jacqueline M
Bought by
Jusiak Paul
Create a Home Valuation Report for This Property
The Home Valuation Report is an in-depth analysis detailing your home's value as well as a comparison with similar homes in the area
Home Values in the Area
Average Home Value in this Area
Purchase History
| Date | Buyer | Sale Price | Title Company |
|---|---|---|---|
| Jusiak Paul | -- | Westcor Land Title | |
| Jusiak Paul | $142,000 | -- |
Source: Public Records
Mortgage History
| Date | Status | Borrower | Loan Amount |
|---|---|---|---|
| Open | Jusiak Paul | $163,614 | |
| Closed | Jusiak Paul | $0 |
Source: Public Records
Tax History Compared to Growth
Tax History
| Year | Tax Paid | Tax Assessment Tax Assessment Total Assessment is a certain percentage of the fair market value that is determined by local assessors to be the total taxable value of land and additions on the property. | Land | Improvement |
|---|---|---|---|---|
| 2025 | $7,268 | $139,100 | $39,500 | $99,600 |
| 2024 | $7,172 | $139,100 | $39,500 | $99,600 |
| 2023 | $7,172 | $139,100 | $39,500 | $99,600 |
| 2022 | $6,979 | $139,100 | $39,500 | $99,600 |
| 2021 | $6,784 | $139,100 | $39,500 | $99,600 |
| 2020 | $6,600 | $139,100 | $39,500 | $99,600 |
| 2019 | $6,481 | $139,100 | $39,500 | $99,600 |
| 2018 | $6,424 | $139,100 | $39,500 | $99,600 |
| 2017 | $6,329 | $139,100 | $39,500 | $99,600 |
| 2016 | $6,130 | $139,100 | $39,500 | $99,600 |
| 2015 | $5,919 | $139,100 | $39,500 | $99,600 |
| 2014 | $6,116 | $90,700 | $25,000 | $65,700 |
Source: Public Records
Map
Nearby Homes