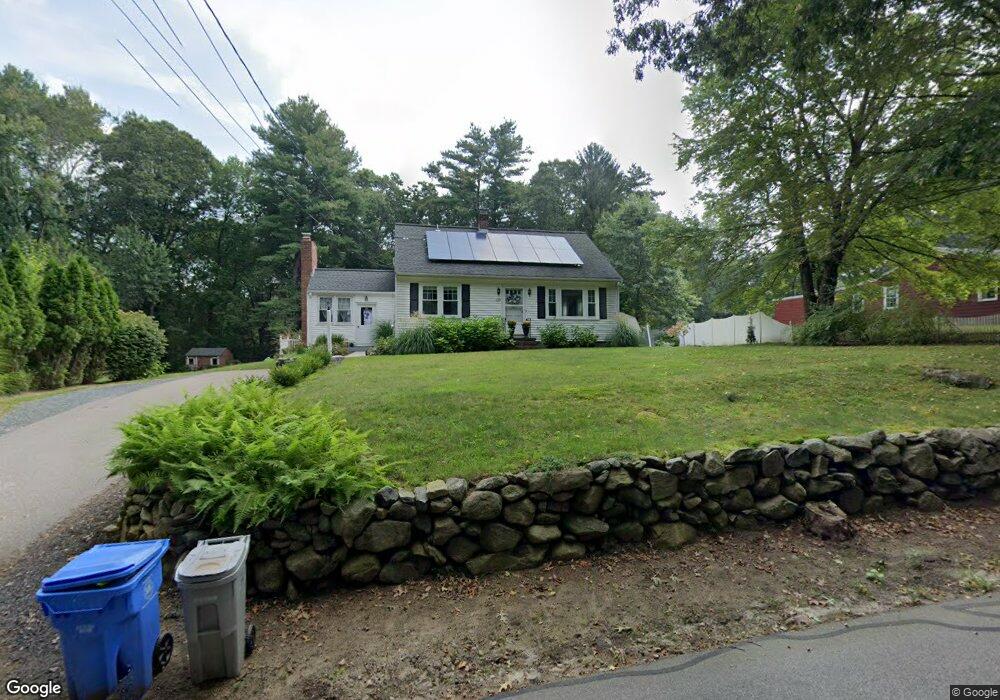
129 Adams St Holliston, MA 01746
Estimated Value: $622,495 - $684,000
3
Beds
2
Baths
1,736
Sq Ft
$379/Sq Ft
Est. Value
About This Home
This home is located at 129 Adams St, Holliston, MA 01746 and is currently estimated at $658,374, approximately $379 per square foot. 129 Adams St is a home located in Middlesex County with nearby schools including Miller Elementary School, Robert H. Adams Middle School, and Holliston High School.
Ownership History
Date
Name
Owned For
Owner Type
Purchase Details
Closed on
Jan 26, 2022
Sold by
Fields John S and Fields Cynthia L
Bought by
Fields & Ardito Ft
Current Estimated Value
Purchase Details
Closed on
Apr 1, 2002
Sold by
Howard Thomas E and Howard Patricia E
Bought by
Fields John and Fields Cynthia A
Home Financials for this Owner
Home Financials are based on the most recent Mortgage that was taken out on this home.
Original Mortgage
$229,500
Interest Rate
6.88%
Mortgage Type
Purchase Money Mortgage
Create a Home Valuation Report for This Property
The Home Valuation Report is an in-depth analysis detailing your home's value as well as a comparison with similar homes in the area
Home Values in the Area
Average Home Value in this Area
Purchase History
| Date | Buyer | Sale Price | Title Company |
|---|---|---|---|
| Fields & Ardito Ft | -- | None Available | |
| Fields John | $270,000 | -- |
Source: Public Records
Mortgage History
| Date | Status | Borrower | Loan Amount |
|---|---|---|---|
| Previous Owner | Fields John | $229,500 |
Source: Public Records
Tax History Compared to Growth
Tax History
| Year | Tax Paid | Tax Assessment Tax Assessment Total Assessment is a certain percentage of the fair market value that is determined by local assessors to be the total taxable value of land and additions on the property. | Land | Improvement |
|---|---|---|---|---|
| 2025 | $6,925 | $472,700 | $291,600 | $181,100 |
| 2024 | $6,982 | $463,600 | $291,600 | $172,000 |
| 2023 | $6,500 | $422,100 | $275,300 | $146,800 |
| 2022 | $7,204 | $414,500 | $275,300 | $139,200 |
| 2021 | $6,699 | $375,300 | $236,100 | $139,200 |
| 2020 | $6,307 | $334,600 | $209,000 | $125,600 |
| 2019 | $6,285 | $333,800 | $203,000 | $130,800 |
| 2018 | $6,232 | $333,800 | $203,000 | $130,800 |
| 2017 | $6,112 | $330,000 | $194,800 | $135,200 |
| 2016 | $5,738 | $305,400 | $170,200 | $135,200 |
| 2015 | $5,636 | $290,800 | $140,400 | $150,400 |
Source: Public Records
Map
Nearby Homes
- 56 Paul Rd
- 30 Arthur St
- 85 Fisher St
- 78 Fisher St
- Lot 2 Hanlon Rd
- 4 E Charles St
- 4 Deerfield Rd
- 15 Broad Acres Farm Rd
- 6 Rainbow Dr
- Lot 1 Florence St
- 114 Walden Way Unit 114
- 15 Free St
- 75 Ridge Rd
- 11 Shadowbrook Ln Unit 9
- 3 Shadowbrook Ln Unit 3
- 18 Shadowbrook Ln Unit 17
- 14 Shadowbrook Ln Unit 30
- 17 Middleton St
- 10 Shadowbrook Ln Unit 24
- 8 Shadowbrook Ln Unit 39