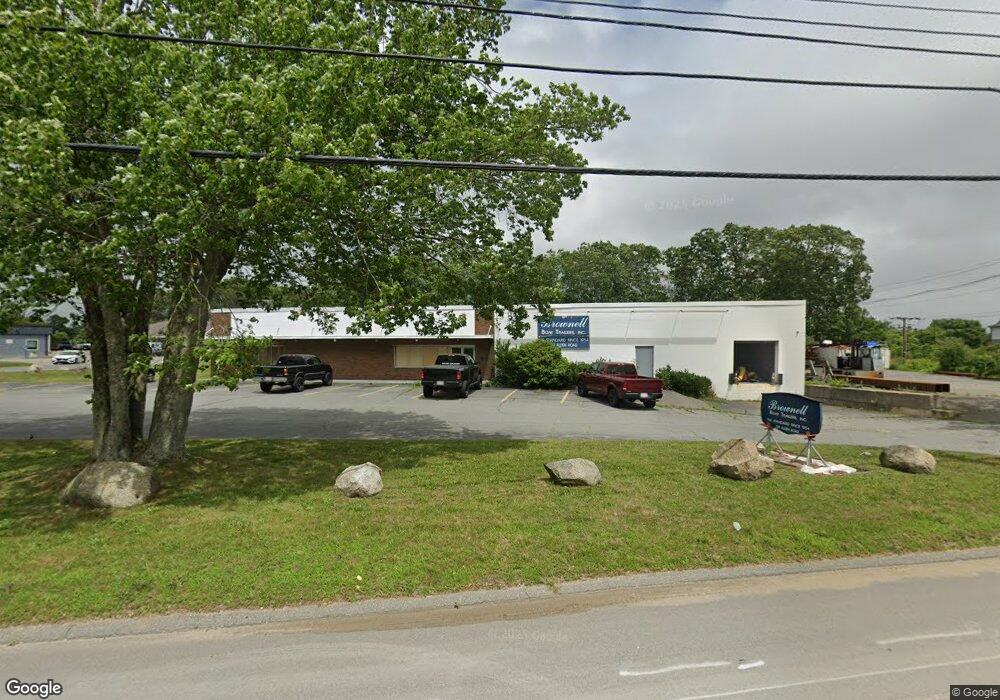
129 Alden Rd Fair Haven, MA 02719
Oxford NeighborhoodEstimated Value: $1,523,068
--
Bed
--
Bath
7,800
Sq Ft
$195/Sq Ft
Est. Value
About This Home
This home is located at 129 Alden Rd, Fair Haven, MA 02719 and is currently estimated at $1,523,068, approximately $195 per square foot. 129 Alden Rd is a home located in Bristol County with nearby schools including Fairhaven High School, City On A Hill Charter Public School New Bedford, and St. Joseph School.
Ownership History
Date
Name
Owned For
Owner Type
Purchase Details
Closed on
Dec 23, 2016
Sold by
Pequod Eat Llc
Bought by
129 Alden Road Llc
Current Estimated Value
Home Financials for this Owner
Home Financials are based on the most recent Mortgage that was taken out on this home.
Original Mortgage
$600,000
Outstanding Balance
$485,236
Interest Rate
3.57%
Mortgage Type
Commercial
Estimated Equity
$1,037,832
Purchase Details
Closed on
Mar 5, 2008
Sold by
Pequod Eat Llc
Bought by
Nstar Electric Co
Purchase Details
Closed on
Dec 14, 2007
Sold by
Pema Nt and Gamache Matthew A
Bought by
Pequod Eat Llc and Shainberg Peter
Home Financials for this Owner
Home Financials are based on the most recent Mortgage that was taken out on this home.
Original Mortgage
$772,000
Interest Rate
6.3%
Mortgage Type
Commercial
Create a Home Valuation Report for This Property
The Home Valuation Report is an in-depth analysis detailing your home's value as well as a comparison with similar homes in the area
Home Values in the Area
Average Home Value in this Area
Purchase History
| Date | Buyer | Sale Price | Title Company |
|---|---|---|---|
| 129 Alden Road Llc | $715,000 | -- | |
| Nstar Electric Co | -- | -- | |
| Pequod Eat Llc | $772,000 | -- |
Source: Public Records
Mortgage History
| Date | Status | Borrower | Loan Amount |
|---|---|---|---|
| Open | 129 Alden Road Llc | $600,000 | |
| Previous Owner | Pequod Eat Llc | $772,000 |
Source: Public Records
Tax History Compared to Growth
Tax History
| Year | Tax Paid | Tax Assessment Tax Assessment Total Assessment is a certain percentage of the fair market value that is determined by local assessors to be the total taxable value of land and additions on the property. | Land | Improvement |
|---|---|---|---|---|
| 2025 | $155 | $837,000 | $454,700 | $382,300 |
| 2024 | $15,203 | $827,600 | $441,600 | $386,000 |
| 2023 | $14,669 | $741,600 | $398,000 | $343,600 |
| 2022 | $14,416 | $707,000 | $376,300 | $330,700 |
| 2021 | $14,408 | $639,500 | $332,700 | $306,800 |
| 2020 | $14,095 | $639,500 | $332,700 | $306,800 |
| 2019 | $14,549 | $619,900 | $313,100 | $306,800 |
| 2018 | $14,282 | $601,100 | $300,000 | $301,100 |
| 2017 | $13,288 | $547,500 | $289,100 | $258,400 |
| 2016 | $12,856 | $525,800 | $267,400 | $258,400 |
| 2015 | $12,882 | $525,800 | $267,400 | $258,400 |
Source: Public Records
Map
Nearby Homes