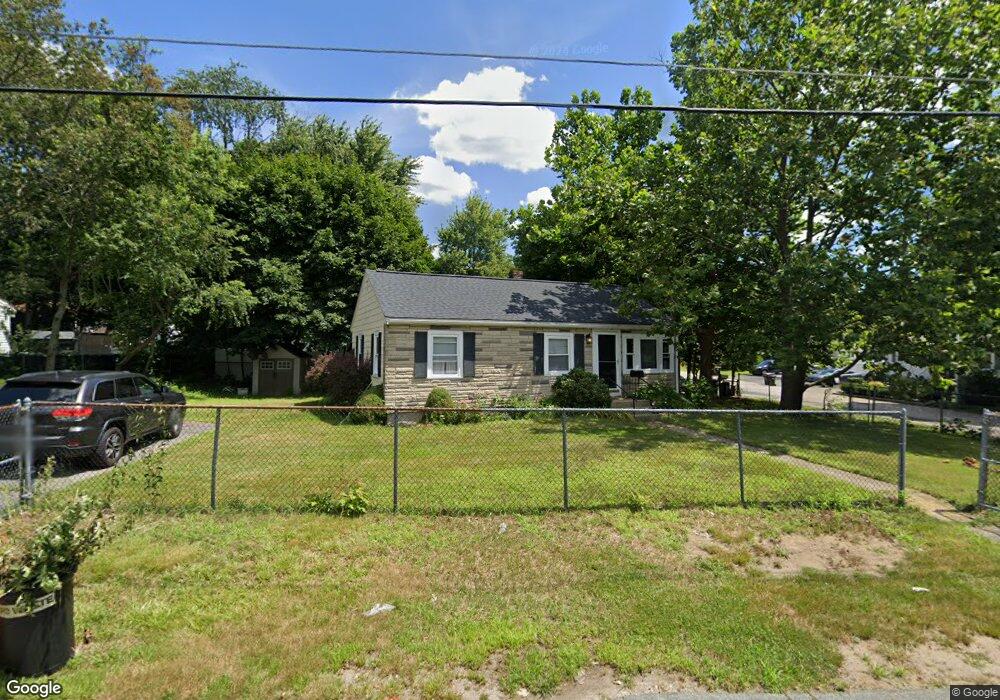
129 Algonquin St Brockton, MA 02302
Estimated Value: $404,130 - $422,000
3
Beds
1
Bath
800
Sq Ft
$519/Sq Ft
Est. Value
About This Home
This home is located at 129 Algonquin St, Brockton, MA 02302 and is currently estimated at $415,033, approximately $518 per square foot. 129 Algonquin St is a home located in Plymouth County with nearby schools including Brookfield Elementary School, Downey Elementary School, and Ashfield Middle School.
Ownership History
Date
Name
Owned For
Owner Type
Purchase Details
Closed on
Jul 31, 2007
Sold by
Somario Stephen
Bought by
Shannon Lauren C
Current Estimated Value
Home Financials for this Owner
Home Financials are based on the most recent Mortgage that was taken out on this home.
Original Mortgage
$172,000
Outstanding Balance
$109,568
Interest Rate
6.78%
Mortgage Type
Purchase Money Mortgage
Estimated Equity
$305,465
Purchase Details
Closed on
May 2, 2007
Sold by
Wells Fargo Bk
Bought by
Somario Stephen R
Purchase Details
Closed on
Jan 30, 2007
Sold by
Davenport Denise and Croft Nicole
Bought by
Mass Res Nt Svcs Llc
Purchase Details
Closed on
Jun 23, 2005
Sold by
Younger Tina Marie
Bought by
Davenport Denise and Croft Nicole
Create a Home Valuation Report for This Property
The Home Valuation Report is an in-depth analysis detailing your home's value as well as a comparison with similar homes in the area
Home Values in the Area
Average Home Value in this Area
Purchase History
| Date | Buyer | Sale Price | Title Company |
|---|---|---|---|
| Shannon Lauren C | $215,000 | -- | |
| Somario Stephen R | $177,000 | -- | |
| Mass Res Nt Svcs Llc | $211,500 | -- | |
| Davenport Denise | $230,000 | -- |
Source: Public Records
Mortgage History
| Date | Status | Borrower | Loan Amount |
|---|---|---|---|
| Open | Davenport Denise | $172,000 | |
| Closed | Davenport Denise | $28,000 |
Source: Public Records
Tax History Compared to Growth
Tax History
| Year | Tax Paid | Tax Assessment Tax Assessment Total Assessment is a certain percentage of the fair market value that is determined by local assessors to be the total taxable value of land and additions on the property. | Land | Improvement |
|---|---|---|---|---|
| 2025 | $4,396 | $363,000 | $143,800 | $219,200 |
| 2024 | $3,971 | $330,400 | $143,800 | $186,600 |
| 2023 | $4,003 | $308,400 | $108,500 | $199,900 |
| 2022 | $3,459 | $247,600 | $98,500 | $149,100 |
| 2021 | $3,242 | $223,600 | $90,500 | $133,100 |
| 2020 | $2,998 | $197,900 | $87,000 | $110,900 |
| 2019 | $2,884 | $185,600 | $80,200 | $105,400 |
| 2018 | $2,841 | $176,900 | $80,200 | $96,700 |
| 2017 | $2,481 | $154,100 | $80,200 | $73,900 |
| 2016 | $2,130 | $122,700 | $76,500 | $46,200 |
| 2015 | $2,116 | $116,600 | $76,500 | $40,100 |
| 2014 | $2,299 | $126,800 | $76,500 | $50,300 |
Source: Public Records
Map
Nearby Homes
- 220 Anawan St
- 137 Algonquin St
- 130 Algonquin St
- 52 Bradley Ave
- 58 Bradley Ave
- 121 Algonquin St
- 143 Algonquin St
- 138 Algonquin St
- 221 Anawan St
- 200 Anawan St
- 122 Algonquin St
- 62 Bradley Ave
- 42 Bradley Ave
- 149 Algonquin St
- 115 Algonquin St
- 199 Anawan St
- 141 Drew Ave
- 68 Bradley Ave
- 133 Drew Ave
- 150 Algonquin St