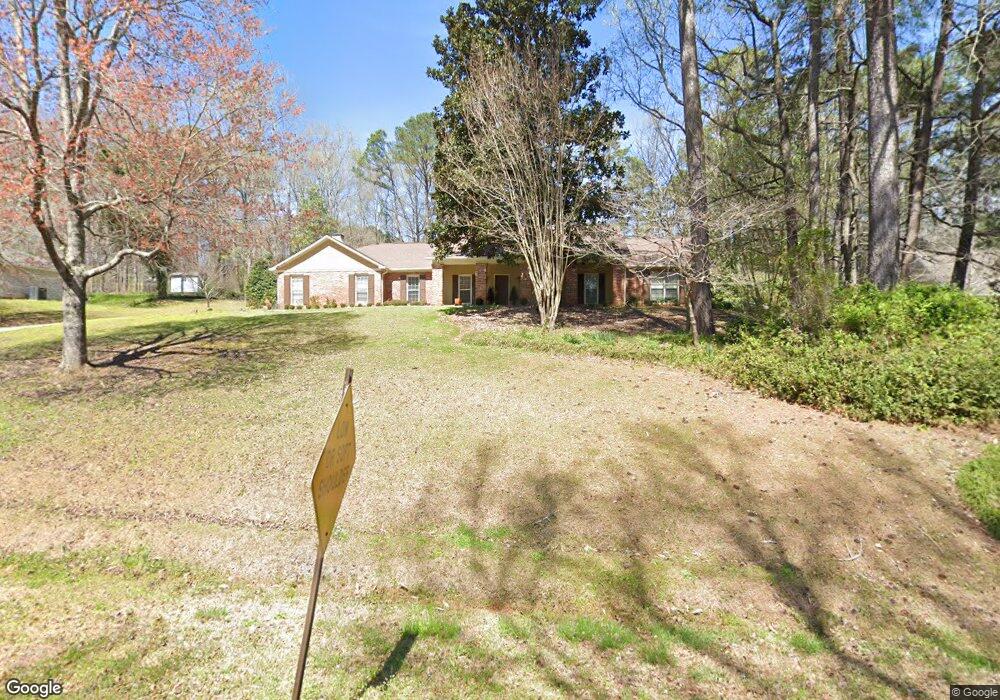
129 Ashling Dr Lagrange, GA 30240
Estimated Value: $337,074 - $365,000
4
Beds
2
Baths
2,235
Sq Ft
$158/Sq Ft
Est. Value
About This Home
This home is located at 129 Ashling Dr, Lagrange, GA 30240 and is currently estimated at $352,269, approximately $157 per square foot. 129 Ashling Dr is a home located in Troup County with nearby schools including Franklin Forest Elementary School, Hollis Hand Elementary School, and Ethel W. Kight Elementary School.
Ownership History
Date
Name
Owned For
Owner Type
Purchase Details
Closed on
May 31, 2006
Sold by
Johnson Lisa M
Bought by
Stanford Amelia Gail
Current Estimated Value
Purchase Details
Closed on
Jun 11, 2004
Sold by
Michael Eugene Johnson
Bought by
Lisa M Johnson
Purchase Details
Closed on
May 2, 1990
Sold by
Waters
Bought by
Michael Eugene Johnson
Purchase Details
Closed on
Jan 1, 1988
Sold by
Lois Keith and Lois Curry
Bought by
Waters
Purchase Details
Closed on
Feb 1, 1986
Sold by
Dan Ric Inc
Bought by
Lois Keith and Lois Curry
Purchase Details
Closed on
Sep 1, 1985
Sold by
Andrea Jimmy R and Andrea Moncus
Bought by
Dan Ric Inc
Purchase Details
Closed on
May 1, 1985
Sold by
Carol Derek and Carol Bowen
Bought by
Andrea Jimmy R and Andrea Moncus
Purchase Details
Closed on
Aug 29, 1983
Sold by
Dan Ric and West Ga Est
Bought by
Carol Derek and Carol Bowen
Purchase Details
Closed on
Jun 29, 1981
Bought by
Dan Ric and West Ga Est
Create a Home Valuation Report for This Property
The Home Valuation Report is an in-depth analysis detailing your home's value as well as a comparison with similar homes in the area
Purchase History
| Date | Buyer | Sale Price | Title Company |
|---|---|---|---|
| Stanford Amelia Gail | $147,600 | -- | |
| Lisa M Johnson | -- | -- | |
| Michael Eugene Johnson | $133,000 | -- | |
| Waters | -- | -- | |
| Lois Keith | -- | -- | |
| Dan Ric Inc | -- | -- | |
| Andrea Jimmy R | -- | -- | |
| Carol Derek | -- | -- | |
| Dan Ric | -- | -- |
Source: Public Records
Tax History
| Year | Tax Paid | Tax Assessment Tax Assessment Total Assessment is a certain percentage of the fair market value that is determined by local assessors to be the total taxable value of land and additions on the property. | Land | Improvement |
|---|---|---|---|---|
| 2025 | $3,333 | $130,800 | $18,000 | $112,800 |
| 2024 | $3,007 | $112,240 | $18,000 | $94,240 |
| 2023 | $2,842 | $106,200 | $14,000 | $92,200 |
| 2022 | $2,781 | $101,640 | $14,000 | $87,640 |
| 2021 | $2,453 | $83,320 | $14,000 | $69,320 |
| 2020 | $2,453 | $83,320 | $14,000 | $69,320 |
| 2019 | $2,145 | $73,120 | $12,000 | $61,120 |
| 2018 | $2,046 | $69,840 | $10,160 | $59,680 |
| 2017 | $1,913 | $65,420 | $8,700 | $56,720 |
| 2016 | $1,879 | $64,271 | $8,700 | $55,571 |
| 2015 | $1,927 | $65,767 | $10,196 | $55,571 |
| 2014 | $1,842 | $62,842 | $10,196 | $52,646 |
| 2013 | -- | $66,084 | $10,092 | $55,992 |
Source: Public Records
Map
Nearby Homes
- 104 Englewood Dr
- 104 Sweetgum Dr
- 1784 Mooty Bridge Rd
- 114 Red Oak Trail
- 502 Ashford Cir
- 91 Richmond Dr
- 103 Windridge
- 107 Windridge
- 103 Woodchase
- 204 Dixie Creek Dr
- 209 River Oaks Dr
- 102 Beech Creek Dr
- 109 Windridge
- 110 Pond View Point
- 201 S Chilton Crescent
- 203 S Chilton Crescent
- 732 Camellia Dr
- 134 S Page St
- 724 Camellia Dr
- 106 Ewing St
- 127 Ashling Dr
- 131 Ashling Dr
- 112 Kildare Ct
- 110 Kildare Ct
- 125 Ashling Dr
- 130 Ashling Dr
- 128 Ashling Dr
- 133 Ashling Dr
- 108 Kildare Ct
- 132 Ashling Dr
- 126 Ashling Dr
- 123 Ashling Dr
- 134 Ashling Dr
- 111 Kildare Ct
- 124 Ashling Dr
- 115 Kildare Ct
- 113 Kildare Ct
- 109 Kildare Ct
- 125 St Anthony Dr
- 107 Kildare Ct
Your Personal Tour Guide
Ask me questions while you tour the home.