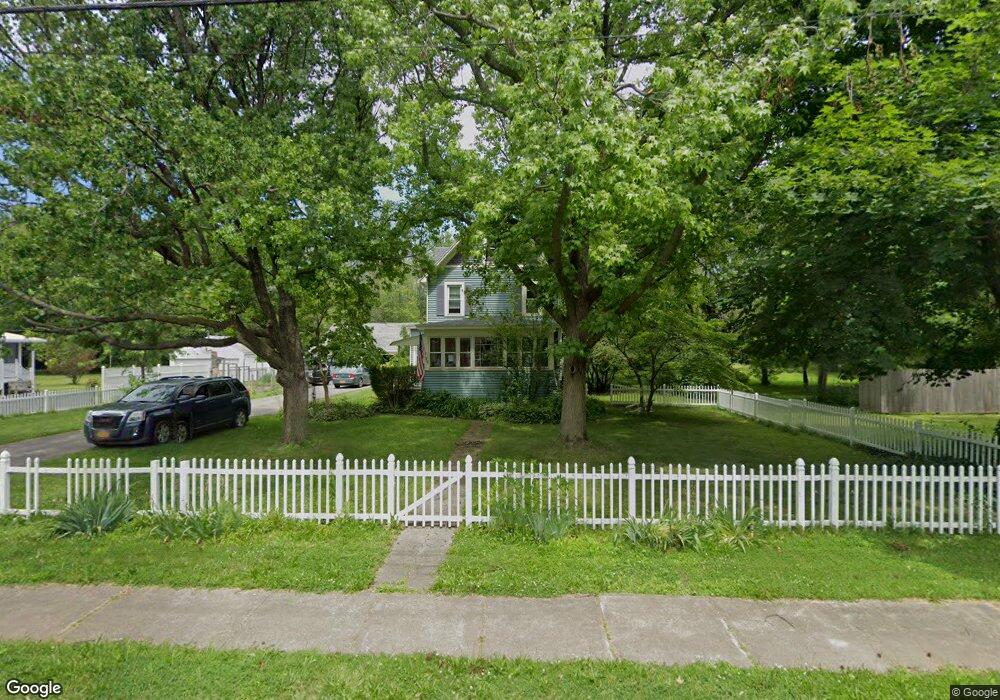
129 Barry St Brockport, NY 14420
Estimated Value: $220,000 - $289,448
4
Beds
1
Bath
1,807
Sq Ft
$145/Sq Ft
Est. Value
About This Home
This home is located at 129 Barry St, Brockport, NY 14420 and is currently estimated at $262,362, approximately $145 per square foot. 129 Barry St is a home located in Monroe County with nearby schools including Ginther Elementary School, Barclay Elementary School, and Fred W. Hill Elementary School.
Ownership History
Date
Name
Owned For
Owner Type
Purchase Details
Closed on
Oct 28, 2009
Sold by
Holcomb Mark T and Holcomb Elizabeth A M
Bought by
Manchester Scott C and Manchester Katherine E
Current Estimated Value
Home Financials for this Owner
Home Financials are based on the most recent Mortgage that was taken out on this home.
Original Mortgage
$100,800
Outstanding Balance
$65,751
Interest Rate
4.98%
Mortgage Type
New Conventional
Estimated Equity
$196,611
Purchase Details
Closed on
Oct 22, 1998
Sold by
Executrix Munier Hel-Individu
Bought by
Holcomb Mark T and Holcomb Elizabeth A M
Create a Home Valuation Report for This Property
The Home Valuation Report is an in-depth analysis detailing your home's value as well as a comparison with similar homes in the area
Home Values in the Area
Average Home Value in this Area
Purchase History
| Date | Buyer | Sale Price | Title Company |
|---|---|---|---|
| Manchester Scott C | $126,000 | None Available | |
| Holcomb Mark T | $88,900 | -- |
Source: Public Records
Mortgage History
| Date | Status | Borrower | Loan Amount |
|---|---|---|---|
| Open | Manchester Scott C | $100,800 |
Source: Public Records
Tax History Compared to Growth
Tax History
| Year | Tax Paid | Tax Assessment Tax Assessment Total Assessment is a certain percentage of the fair market value that is determined by local assessors to be the total taxable value of land and additions on the property. | Land | Improvement |
|---|---|---|---|---|
| 2024 | $7,850 | $219,500 | $29,200 | $190,300 |
| 2023 | $7,376 | $176,600 | $21,600 | $155,000 |
| 2022 | $6,576 | $176,600 | $21,600 | $155,000 |
| 2021 | $6,576 | $151,700 | $21,600 | $130,100 |
| 2020 | $6,153 | $146,200 | $21,600 | $124,600 |
| 2019 | $5,782 | $128,800 | $21,600 | $107,200 |
| 2018 | $5,837 | $128,800 | $21,600 | $107,200 |
| 2017 | $2,355 | $126,300 | $21,600 | $104,700 |
| 2016 | $5,782 | $126,300 | $21,600 | $104,700 |
| 2015 | -- | $126,300 | $21,600 | $104,700 |
| 2014 | -- | $126,300 | $21,600 | $104,700 |
Source: Public Records
Map
Nearby Homes