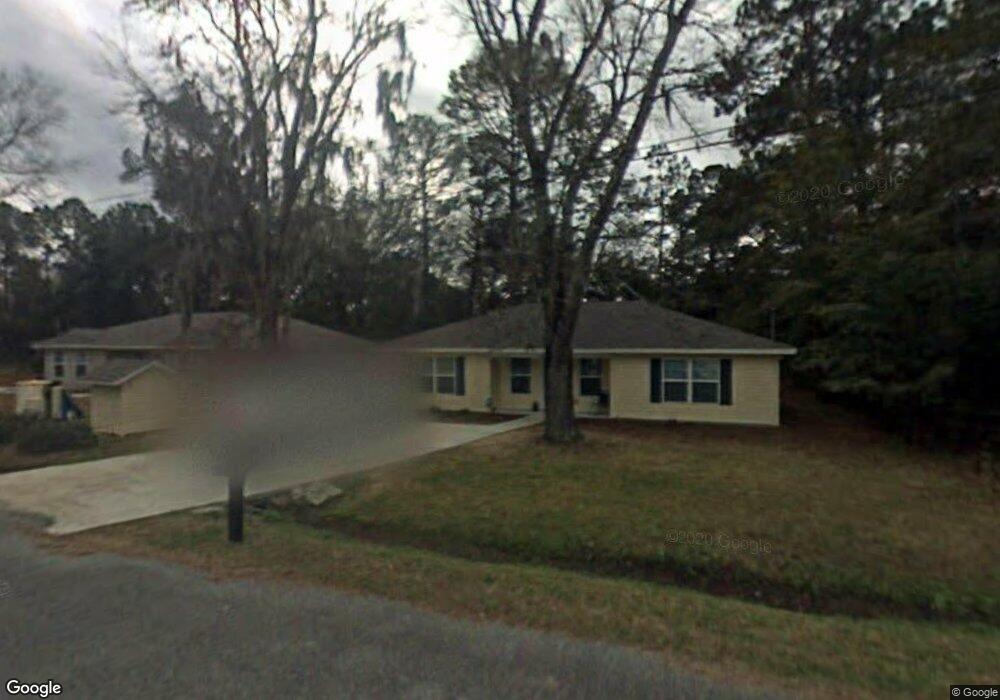
129 Blueberry Rd Brunswick, GA 31525
Estimated Value: $185,000 - $299,000
4
Beds
2
Baths
1,911
Sq Ft
$123/Sq Ft
Est. Value
About This Home
This home is located at 129 Blueberry Rd, Brunswick, GA 31525 and is currently estimated at $235,416, approximately $123 per square foot. 129 Blueberry Rd is a home located in Glynn County with nearby schools including Greer Elementary School, Needwood Middle School, and Brunswick High School.
Ownership History
Date
Name
Owned For
Owner Type
Purchase Details
Closed on
Sep 24, 2013
Sold by
Mitchell Crawford S
Bought by
Mitchell Crawford Samuel
Current Estimated Value
Purchase Details
Closed on
Jun 5, 2013
Sold by
Us Bank National Assocaiti
Bought by
Mitchell Crawford S
Home Financials for this Owner
Home Financials are based on the most recent Mortgage that was taken out on this home.
Original Mortgage
$69,479
Interest Rate
3.42%
Mortgage Type
New Conventional
Purchase Details
Closed on
Dec 4, 2012
Sold by
Daniel Michael
Bought by
Us Bank National Assocaition T and Citigroup Mtg Loan Trust Inc
Purchase Details
Closed on
May 2, 2006
Sold by
Sunflower Inc
Bought by
Daniel Michael
Home Financials for this Owner
Home Financials are based on the most recent Mortgage that was taken out on this home.
Original Mortgage
$107,200
Interest Rate
9.25%
Mortgage Type
New Conventional
Create a Home Valuation Report for This Property
The Home Valuation Report is an in-depth analysis detailing your home's value as well as a comparison with similar homes in the area
Home Values in the Area
Average Home Value in this Area
Purchase History
| Date | Buyer | Sale Price | Title Company |
|---|---|---|---|
| Mitchell Crawford Samuel | -- | -- | |
| Mitchell Crawford S | $77,199 | -- | |
| Us Bank National Assocaition T | $68,474 | -- | |
| Daniel Michael | $134,000 | -- |
Source: Public Records
Mortgage History
| Date | Status | Borrower | Loan Amount |
|---|---|---|---|
| Previous Owner | Mitchell Crawford S | $69,479 | |
| Previous Owner | Daniel Michael | $107,200 | |
| Previous Owner | Daniel Michael | $26,800 |
Source: Public Records
Tax History Compared to Growth
Tax History
| Year | Tax Paid | Tax Assessment Tax Assessment Total Assessment is a certain percentage of the fair market value that is determined by local assessors to be the total taxable value of land and additions on the property. | Land | Improvement |
|---|---|---|---|---|
| 2025 | $1,489 | $59,360 | $4,000 | $55,360 |
| 2024 | $1,496 | $59,640 | $4,000 | $55,640 |
| 2023 | $294 | $59,640 | $4,000 | $55,640 |
| 2022 | $408 | $58,080 | $2,440 | $55,640 |
| 2021 | $416 | $57,040 | $2,440 | $54,600 |
| 2020 | $424 | $57,040 | $2,440 | $54,600 |
| 2019 | $424 | $57,040 | $2,440 | $54,600 |
| 2018 | $438 | $57,040 | $2,440 | $54,600 |
| 2017 | $438 | $49,480 | $2,440 | $47,040 |
| 2016 | $372 | $49,480 | $2,440 | $47,040 |
| 2015 | $372 | $49,480 | $2,440 | $47,040 |
| 2014 | $372 | $49,480 | $2,440 | $47,040 |
Source: Public Records
Map
Nearby Homes
- 156 Sherwood Forest Cir
- 116 Smith Rd
- 101 Winton Dr
- 115 Winton Dr
- 4548 U S 17
- 110 Thornhill Dr
- 203 Willow Pond Way
- 109 Willow Pond Way
- 138 Thornhill Dr
- 211 N Deerfield Dr
- 213 N Deerfield Dr
- 103 Cooper Cir
- 130 Tupelo Cir
- 4936 U S 17
- 201 Stillwater Dr
- 109 MacKqueen Dr
- 212 Stillwater Dr
- 118 MacKqueen Dr
- 138 Mackay Dr
- 123 Blueberry Rd
- 133 Blueberry Rd
- 115 Blueberry Rd
- 115 Blueberry Rd Unit 1
- 134 Blueberry Rd
- Tract 3 Blueberry Rd
- 143 Blueberry Rd
- 118 Blueberry Rd
- 155 Blueberry Rd
- 4655 Us Highway 17 N
- 4657 Us Highway 17 N
- 162 Blueberry Rd
- 5 Sherwood Forest Cir
- 3401 Sidney Lanier Dr
- 144 Joann Dr
- 127 Merrill Ct
- 143 Joann Dr
- 142 Joann Dr
- 125 Merrill Ct
- 0 Sherwood Forest Cir