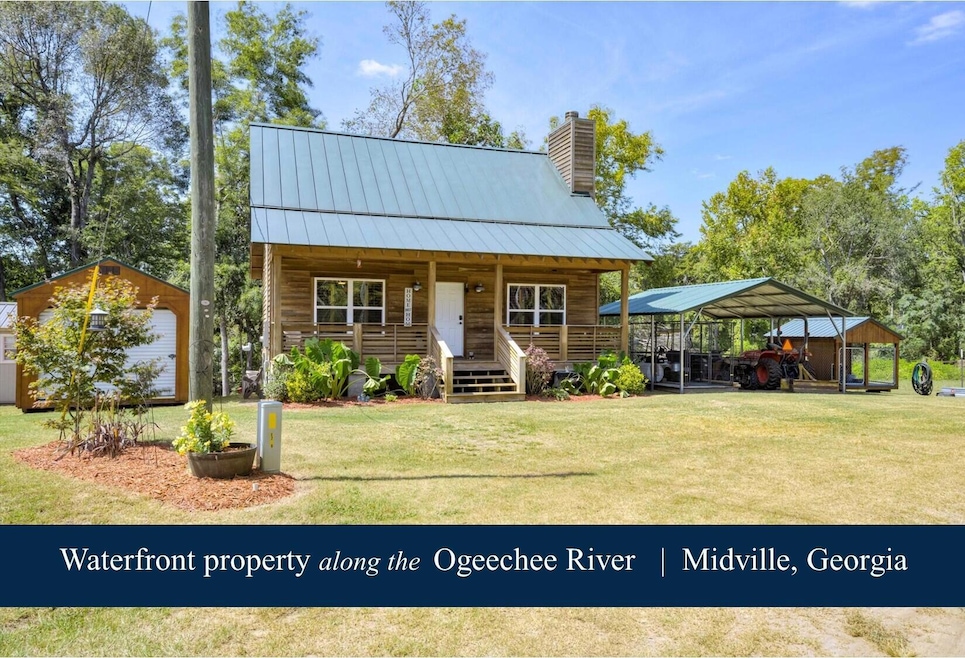
129 Brannen Landing Midville, GA 30441
Estimated payment $1,607/month
Highlights
- Boat Ramp
- Vaulted Ceiling
- Main Floor Primary Bedroom
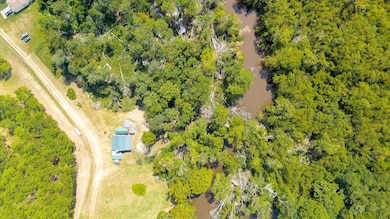
- River Front
- Wood Flooring
- No HOA
About This Home
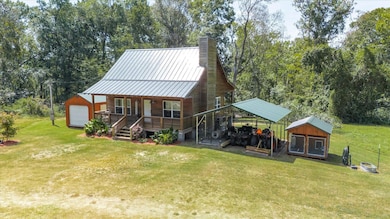
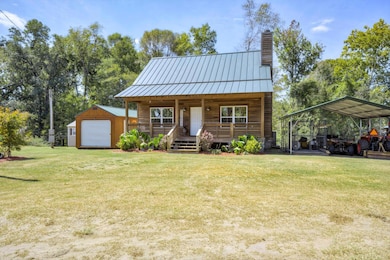
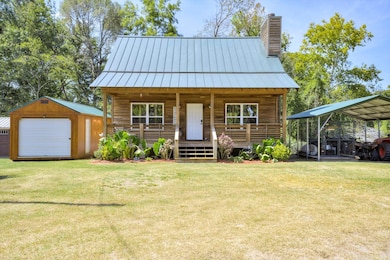
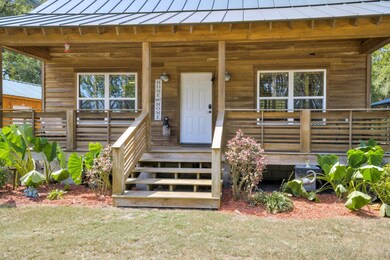
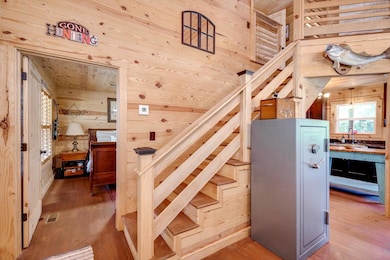
Enjoy this Ogeechee River waterfront property as a riverside getaway or as a private rural residence...either way, this thoughtfully built cabin offers an absolutely move-in ready experience in a beautiful setting. Situated on a 0.67-acre lot and built in 2019, this Cypress sided cabin features 1,008 square feet, including 2 bedrooms, 1.5 bathrooms and an efficient floorplan that's as functional as it is cozy. With 8-inch tongue-and-groove pine floors and ceilings, custom plantation shutters, a standing seam metal roof, and covered porches spanning the front and back, the home offers rich character in so many details. Enjoy the open feel of the living room with vaulted ceilings and a wood-burning fireplace set off by a custom mantel planed from a century-old Hickory. The open-floor plans flows into the dining area and kitchen, which features granite countertops, custom cabinetry to the ceiling, stainless steel appliances and a large, apron-front single basin sink. A bedroom, full bathroom with custom tile shower and laundry are positioned on the main floor, while a staircase leads to the loft-style second bedroom with adjacent half bathroom. Large sliding glass doors on the main level lead to the covered back porch, which offers an outdoor living space of its own. Grill, dine or relax in comfort as you take in the scenery offered by the river just a stone's throw away. Other features on the property include a carport, spacious outbuilding with roll-up door and generous storage space for ATVs, tools, and more. Also enjoy a private boat ramp for the neighborhood just 200 yards from the house.Whether you like to fish, enjoy wildlife or simply want to escape to the serenity of the rural riverfront, this property along the Ogeechee River offers a wonderful opportunity to enjoy.
Home Details
Home Type
- Single Family
Est. Annual Taxes
- $1,786
Year Built
- Built in 2019 | Remodeled
Lot Details
- 0.65 Acre Lot
- River Front
- Kennel or Dog Run
Parking
- Detached Carport Space
Home Design
- Cabin
- Metal Roof
- Wood Siding
Interior Spaces
- 1,008 Sq Ft Home
- 2-Story Property
- Vaulted Ceiling
- Fireplace Features Masonry
- Insulated Windows
- Plantation Shutters
- Living Room with Fireplace
- Wood Flooring
- Crawl Space
Kitchen
- Eat-In Kitchen
- Electric Range
- Built-In Microwave
- Farmhouse Sink
Bedrooms and Bathrooms
- 2 Bedrooms
- Primary Bedroom on Main
Attic
- Attic Floors
- Walkup Attic
Outdoor Features
- Covered Patio or Porch
- Outbuilding
Schools
- Waynesboro Elementary School
- Burke County Middle School
- Burke County High School
Utilities
- Central Air
- Multiple Heating Units
- Water Heater
- Shared Septic
Listing and Financial Details
- Assessor Parcel Number 014036
Community Details
Overview
- No Home Owners Association
- None 3Bu Subdivision
Recreation
- Boat Ramp
Map
Home Values in the Area
Average Home Value in this Area
Tax History
| Year | Tax Paid | Tax Assessment Tax Assessment Total Assessment is a certain percentage of the fair market value that is determined by local assessors to be the total taxable value of land and additions on the property. | Land | Improvement |
|---|---|---|---|---|
| 2024 | $1,786 | $76,547 | $12,000 | $64,547 |
| 2023 | $1,695 | $70,049 | $7,200 | $62,849 |
| 2022 | $1,305 | $60,602 | $6,000 | $54,602 |
| 2021 | $1,118 | $50,647 | $6,000 | $44,647 |
| 2020 | $1,120 | $50,647 | $6,000 | $44,647 |
| 2019 | $135 | $6,000 | $6,000 | $0 |
| 2018 | $135 | $6,000 | $6,000 | $0 |
| 2017 | $136 | $6,000 | $6,000 | $0 |
| 2016 | $137 | $6,000 | $6,000 | $0 |
| 2015 | $138 | $6,000 | $6,000 | $0 |
| 2014 | $139 | $6,000 | $6,000 | $0 |
| 2013 | -- | $6,000 | $6,000 | $0 |
Property History
| Date | Event | Price | List to Sale | Price per Sq Ft |
|---|---|---|---|---|
| 10/17/2025 10/17/25 | Price Changed | $276,000 | -1.4% | $274 / Sq Ft |
| 09/14/2025 09/14/25 | For Sale | $280,000 | -- | $278 / Sq Ft |
Purchase History
| Date | Type | Sale Price | Title Company |
|---|---|---|---|
| Warranty Deed | $207,000 | -- | |
| Warranty Deed | -- | -- | |
| Warranty Deed | $20,000 | -- | |
| Interfamily Deed Transfer | -- | -- | |
| Deed | $47,000 | -- | |
| Deed | $31,000 | -- |
Mortgage History
| Date | Status | Loan Amount | Loan Type |
|---|---|---|---|
| Open | $203,250 | FHA | |
| Previous Owner | $31,125 | New Conventional |
Source: REALTORS® of Greater Augusta
MLS Number: 547074
APN: 014-036
Disclaimer: Certain information contained herein is derived from information provided by parties other than Homes.com. All information provided is deemed reliable, but is not guaranteed to be accurate and should be independently verified.
![]() IDX information is provided exclusively for personal, non-commercial use, and may not be used for any purpose other than to identify prospective properties consumers may be interested in purchasing.
IDX information is provided exclusively for personal, non-commercial use, and may not be used for any purpose other than to identify prospective properties consumers may be interested in purchasing.
Information is deemed reliable but not guaranteed.
- LOT 18 the River Landing Rd
- LOT 23 the River Landing
- LOT 19 the River Landing
- LOT 21 the River Landing
- LOT 22 the River Landing
- LOT 20 the River Landing
- 452 Murphy St
- 10145 Georgia 56
- 125 Jones St
- 0 Georgia 305
- 647 Murphy St
- 0 Highway 17 Unit 21752659
- Tbd Highway 56
- 0 Frank Farmer Rd
- 0 Highway 56
- Tbd Highway 56
- 0 Bull Branch Rd
- 1857 Old Savannah Rd
- 00 Georgia 56
- 426 Wadley Coleman Lake Rd
