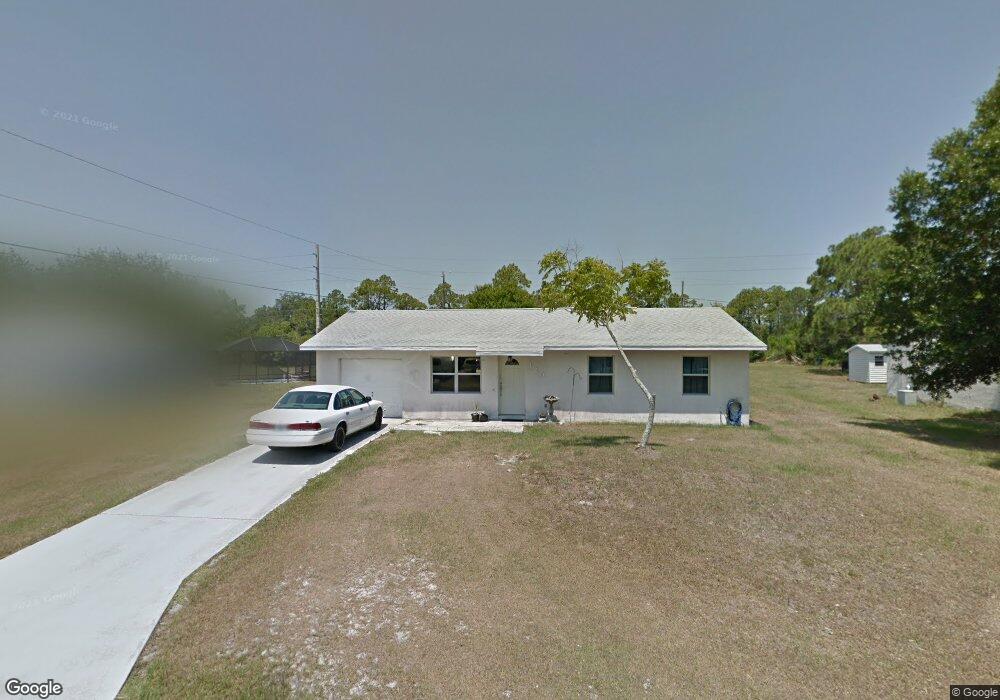
129 Caprona St Sebastian, FL 32958
Sebastian Highlands NeighborhoodEstimated Value: $176,000 - $242,000
2
Beds
1
Bath
924
Sq Ft
$237/Sq Ft
Est. Value
About This Home
This home is located at 129 Caprona St, Sebastian, FL 32958 and is currently estimated at $218,682, approximately $236 per square foot. 129 Caprona St is a home located in Indian River County with nearby schools including Pelican Island Classical Magnet School, Storm Grove Middle School, and Sebastian River High School.
Ownership History
Date
Name
Owned For
Owner Type
Purchase Details
Closed on
Feb 12, 2021
Sold by
Thibedeau Beverly
Bought by
Thibedeau Roella and Thibedeau Philip S
Current Estimated Value
Home Financials for this Owner
Home Financials are based on the most recent Mortgage that was taken out on this home.
Original Mortgage
$80,000
Outstanding Balance
$57,457
Interest Rate
2.2%
Mortgage Type
New Conventional
Estimated Equity
$161,225
Create a Home Valuation Report for This Property
The Home Valuation Report is an in-depth analysis detailing your home's value as well as a comparison with similar homes in the area
Home Values in the Area
Average Home Value in this Area
Purchase History
| Date | Buyer | Sale Price | Title Company |
|---|---|---|---|
| Thibedeau Roella | $100,000 | Professional Ttl Of Treasure | |
| Thibedeau Roella | $100,000 | New Title Company Name |
Source: Public Records
Mortgage History
| Date | Status | Borrower | Loan Amount |
|---|---|---|---|
| Open | Thibedeau Roella | $80,000 | |
| Closed | Thibedeau Roella | $80,000 |
Source: Public Records
Tax History
| Year | Tax Paid | Tax Assessment Tax Assessment Total Assessment is a certain percentage of the fair market value that is determined by local assessors to be the total taxable value of land and additions on the property. | Land | Improvement |
|---|---|---|---|---|
| 2025 | $2,652 | $168,380 | -- | -- |
| 2024 | $2,169 | $168,380 | -- | -- |
| 2023 | $2,169 | $158,869 | $0 | $0 |
| 2022 | $2,070 | $154,242 | $27,703 | $126,539 |
| 2021 | $711 | $56,924 | $0 | $0 |
| 2020 | $706 | $56,138 | $0 | $0 |
| 2019 | $700 | $54,876 | $0 | $0 |
| 2018 | $703 | $53,853 | $0 | $0 |
| 2017 | $641 | $52,745 | $0 | $0 |
| 2016 | $642 | $51,660 | $0 | $0 |
| 2015 | $659 | $51,310 | $0 | $0 |
| 2014 | $628 | $50,910 | $0 | $0 |
Source: Public Records
Map
Nearby Homes
- 975 S Easy St
- 111 Chaloupe Terrace
- 126 Ormond Ct
- 101 Joy Haven Dr
- 110 Marsh St
- 117 Osceola Ave
- 180 Concha Dr
- 137 Concha Dr
- 1167 Schumann Dr
- 143 Concha Dr
- 77 Joy Haven Dr
- 1399 Thornhill Ln
- 1310 Schumann Dr
- 169 Day Dr
- 189 Abeto Terrace
- 101 Landover Dr
- 1545 Barber St
- 318 Brookedge Terrace
- 144 Pelican Island Place
- 201 Joy Haven Dr
Your Personal Tour Guide
Ask me questions while you tour the home.