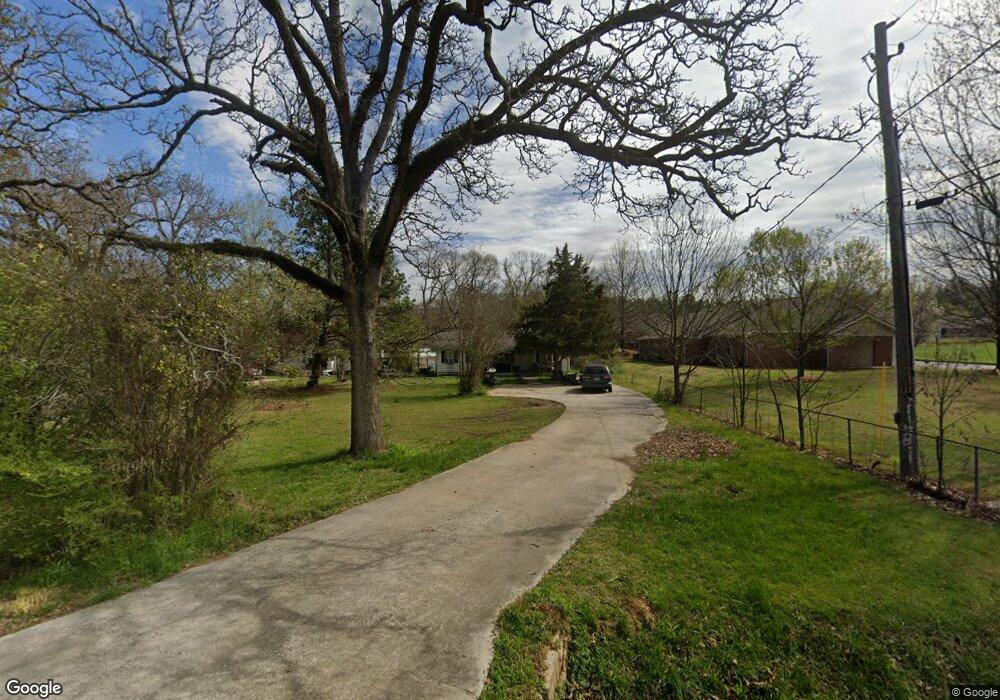
129 Cason Rd Cedartown, GA 30125
Estimated Value: $89,000 - $219,000
3
Beds
2
Baths
1,359
Sq Ft
$123/Sq Ft
Est. Value
About This Home
This home is located at 129 Cason Rd, Cedartown, GA 30125 and is currently estimated at $167,585, approximately $123 per square foot. 129 Cason Rd is a home located in Polk County with nearby schools including Cedar Christian School.
Ownership History
Date
Name
Owned For
Owner Type
Purchase Details
Closed on
Feb 28, 2018
Sold by
Jarrell Elex F
Bought by
J
Current Estimated Value
Purchase Details
Closed on
Oct 8, 2004
Sold by
J K Rentals Ltd
Bought by
Jarrell Elex
Purchase Details
Closed on
Jan 18, 2000
Sold by
Shurley Sadie L
Bought by
J K Rentals Ltd
Purchase Details
Closed on
Dec 9, 1999
Sold by
Holtzclaw Jimmie C
Bought by
Shurley Sadie L
Purchase Details
Closed on
Mar 3, 1981
Sold by
Kuwamoto Shirley Ann
Bought by
Holtzclaw Jimmie L
Purchase Details
Closed on
Nov 19, 1979
Sold by
Holtzclaw Frank
Bought by
Kuwamoto Shirley Ann
Purchase Details
Closed on
Sep 15, 1977
Sold by
Young David H
Bought by
Holtzclaw Frank
Purchase Details
Closed on
Feb 18, 1975
Sold by
Young D H Mrs
Bought by
Young David H
Purchase Details
Closed on
Sep 25, 1951
Sold by
Hunt T P
Bought by
Young Mrs M M**
Create a Home Valuation Report for This Property
The Home Valuation Report is an in-depth analysis detailing your home's value as well as a comparison with similar homes in the area
Home Values in the Area
Average Home Value in this Area
Purchase History
| Date | Buyer | Sale Price | Title Company |
|---|---|---|---|
| J | $137,500 | -- | |
| Jarrell Elex | $41,000 | -- | |
| J K Rentals Ltd | $43,000 | -- | |
| J K Rentals Ltd | -- | -- | |
| Shurley Sadie L | -- | -- | |
| Holtzclaw Jimmie L | -- | -- | |
| Kuwamoto Shirley Ann | -- | -- | |
| Holtzclaw Frank | -- | -- | |
| Young David H | -- | -- | |
| Young Mrs M M** | -- | -- |
Source: Public Records
Tax History Compared to Growth
Tax History
| Year | Tax Paid | Tax Assessment Tax Assessment Total Assessment is a certain percentage of the fair market value that is determined by local assessors to be the total taxable value of land and additions on the property. | Land | Improvement |
|---|---|---|---|---|
| 2024 | $692 | $21,900 | $4,800 | $17,100 |
| 2023 | $419 | $12,094 | $1,452 | $10,642 |
| 2022 | $249 | $10,474 | $1,452 | $9,022 |
| 2021 | $252 | $10,474 | $1,452 | $9,022 |
| 2020 | $252 | $10,474 | $1,452 | $9,022 |
| 2019 | $305 | $12,761 | $2,023 | $10,738 |
| 2018 | $337 | $12,220 | $1,734 | $10,486 |
| 2017 | $333 | $12,220 | $1,734 | $10,486 |
| 2016 | $333 | $12,220 | $1,734 | $10,486 |
| 2015 | $308 | $11,289 | $1,734 | $9,555 |
| 2014 | $310 | $11,289 | $1,734 | $9,555 |
Source: Public Records
Map
Nearby Homes
- 117 Cason Rd
- 203 Cason Rd
- 149 Irwin St
- 0 Philpot Springs Unit 10626665
- 205 Pinecrest Rd
- 129 W Ellawood Ave
- 151 W Ellawood Ave
- 325 Fairview Ave
- 480 Cason Rd
- 234 Brooks St
- 1003 Fairview Ave
- 634 Georgia Ave
- 634 Georgia Ave Unit 123
- 729 S College St
- 129 Thompson St
- 226 Central St
- 2460 Hidden Creek Rd
- 00 Juliette St
- 35 Old Mill Rd
- 217 E Gibson St
- 125 Cason Rd
- 121 Cason Rd
- 148 Cason Dr
- 149 Cason Rd
- 133 Cason Rd
- 1400 S Main St
- 115 Mckibben St
- 1326 Mckibben St
- 1416 Buchanan Hwy
- 117 Mckibben St
- 1324 Mckibben St
- 202 Cason Rd
- 1424 S Main St Unit 258
- 1317 Mckibben St
- 1442 Buchanan Hwy
- 1432 Buchanan Hwy
- 1434 Buchanan Hwy
- 1424 Buchanan Hwy
- 413 Olive St
- 86 Bryant Cir