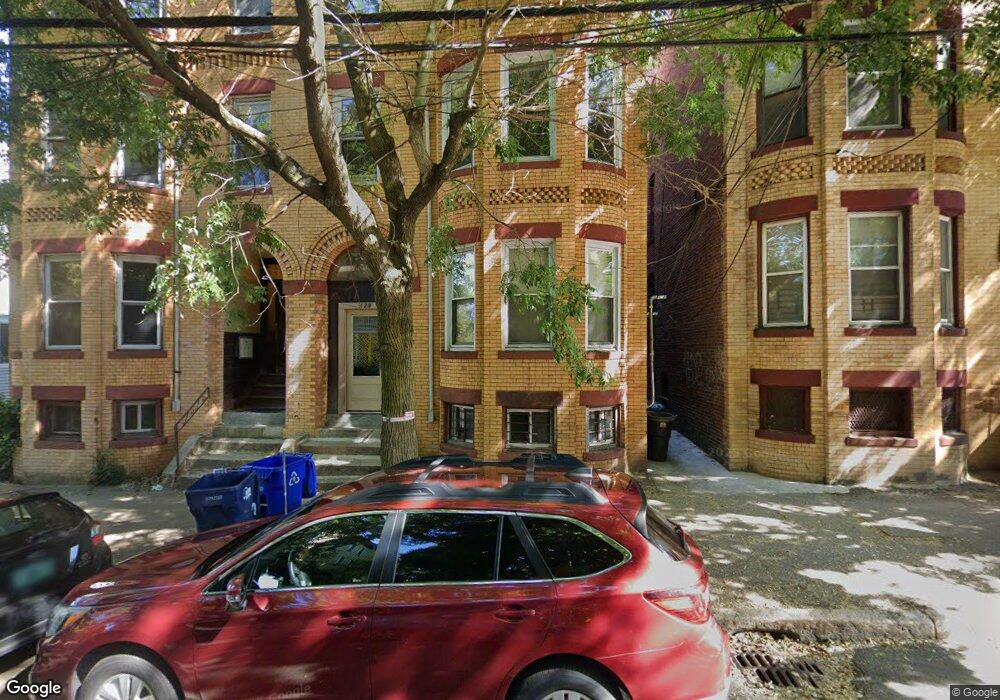
129 Cedar St Roxbury, MA 02119
Fort Hill NeighborhoodEstimated Value: $1,027,000 - $1,190,000
8
Beds
3
Baths
3,789
Sq Ft
$295/Sq Ft
Est. Value
About This Home
Introducing a fantastic opportunity for a spacious 5-bedroom apartment, available September 1, 2025! Designed for comfort and convenience, this apartment is located in a well-maintained apartment complex. Enjoy the ease of laundry facilities in the building, though please note that pets are not allowed. This apartment also comes with no fee paid, making it a great choice for those looking for ample living space in a hassle-free environment. Schedule a viewing today to make this your future home!
Ownership History
Date
Name
Owned For
Owner Type
Purchase Details
Closed on
May 6, 2005
Sold by
Cedar St Rt 129
Bought by
Hung Chia-Pen
Current Estimated Value
Purchase Details
Closed on
Dec 1, 2004
Sold by
Hung Chia-Pen
Bought by
Cedar St Rt
Home Financials for this Owner
Home Financials are based on the most recent Mortgage that was taken out on this home.
Original Mortgage
$350,000
Interest Rate
5.75%
Purchase Details
Closed on
Oct 18, 2004
Sold by
Cedar Street Rt 129
Bought by
Hung Chia-Pen
Home Financials for this Owner
Home Financials are based on the most recent Mortgage that was taken out on this home.
Original Mortgage
$350,000
Interest Rate
5.75%
Purchase Details
Closed on
Nov 12, 2003
Sold by
Cedar St Rt 129
Bought by
129 Cedar St Rlty
Create a Home Valuation Report for This Property
The Home Valuation Report is an in-depth analysis detailing your home's value as well as a comparison with similar homes in the area
Home Values in the Area
Average Home Value in this Area
Purchase History
| Date | Buyer | Sale Price | Title Company |
|---|---|---|---|
| Hung Chia-Pen | -- | -- | |
| Cedar St Rt | -- | -- | |
| Hung Chia-Pen | -- | -- | |
| 129 Cedar St Rlty | $255,000 | -- |
Source: Public Records
Mortgage History
| Date | Status | Borrower | Loan Amount |
|---|---|---|---|
| Previous Owner | 129 Cedar St Rlty | $350,000 |
Source: Public Records
Property History
| Date | Event | Price | List to Sale | Price per Sq Ft |
|---|---|---|---|---|
| 02/10/2025 02/10/25 | Off Market | -- | -- | -- |
| 02/10/2025 02/10/25 | Off Market | -- | -- | -- |
| 02/10/2025 02/10/25 | Off Market | $5,000 | -- | -- |
| 01/30/2025 01/30/25 | For Rent | -- | -- | -- |
| 01/17/2025 01/17/25 | For Rent | -- | -- | -- |
| 01/15/2025 01/15/25 | For Rent | -- | -- | -- |
| 11/29/2024 11/29/24 | Off Market | $4,100 | -- | -- |
| 10/08/2024 10/08/24 | Off Market | $5,000 | -- | -- |
| 10/08/2024 10/08/24 | Off Market | $4,100 | -- | -- |
| 10/08/2024 10/08/24 | Off Market | $5,000 | -- | -- |
| 10/02/2024 10/02/24 | For Rent | $4,100 | -18.0% | -- |
| 09/01/2024 09/01/24 | For Rent | $5,000 | +22.0% | -- |
| 09/01/2024 09/01/24 | For Rent | $4,100 | -18.0% | -- |
| 06/24/2024 06/24/24 | For Rent | $5,000 | -- | -- |
Tax History
| Year | Tax Paid | Tax Assessment Tax Assessment Total Assessment is a certain percentage of the fair market value that is determined by local assessors to be the total taxable value of land and additions on the property. | Land | Improvement |
|---|---|---|---|---|
| 2025 | $11,643 | $1,005,400 | $328,400 | $677,000 |
| 2024 | $9,591 | $879,900 | $222,400 | $657,500 |
| 2023 | $9,000 | $838,000 | $211,800 | $626,200 |
| 2022 | $8,851 | $813,500 | $205,600 | $607,900 |
| 2021 | $8,427 | $789,800 | $199,600 | $590,200 |
| 2020 | $8,349 | $790,600 | $202,700 | $587,900 |
| 2019 | $7,440 | $705,900 | $145,700 | $560,200 |
| 2018 | $6,850 | $653,600 | $145,700 | $507,900 |
| 2017 | $6,922 | $653,600 | $145,700 | $507,900 |
| 2016 | $6,256 | $568,700 | $145,700 | $423,000 |
| 2015 | $5,632 | $465,100 | $104,600 | $360,500 |
| 2014 | $5,319 | $422,800 | $104,600 | $318,200 |
Source: Public Records
Map
Nearby Homes
- 10 Linwood St
- 65 Lambert Ave
- 156-160 Highland St Unit 156
- 80 Terrace St Unit 501
- 134 Terrace St
- 16 Hawthorne St
- 187 Highland St
- 743 Parker St Unit 3
- 27 Dudley St
- 9 W Cedar St Unit 1
- 51 Vale St Unit 1
- 48-50 Dudley St
- 5 Valentine St Unit 1
- 21 Marcella St Unit 2
- 40 Wensley St
- 6 Harleston St Unit 6
- 51 Saint James St
- 111 Heath St
- 2856 Washington St
- 64 Alpine St Unit 104
- 129 Cedar St
- 129 Cedar St Unit 129 Cedar St 2
- 129 Cedar St Unit 2
- 129 Cedar St Unit 1
- 129 Cedar St Unit 3
- 127 Cedar St
- 127 Cedar St Unit Cedar St
- 127 Cedar St Unit 2
- 127 Cedar St
- 127 Cedar St Unit 3
- 127 Cedar St Unit 1
- 131 Cedar St
- 133 Cedar St
- 133 Cedar St
- 133 Cedar St Unit 2
- 133 Cedar St Unit 1B
- 135 Cedar St Unit 1
- 135 Cedar St
- 135 Cedar St Unit 135Cedar
- 135 Cedar St Unit 2
Your Personal Tour Guide
Ask me questions while you tour the home.