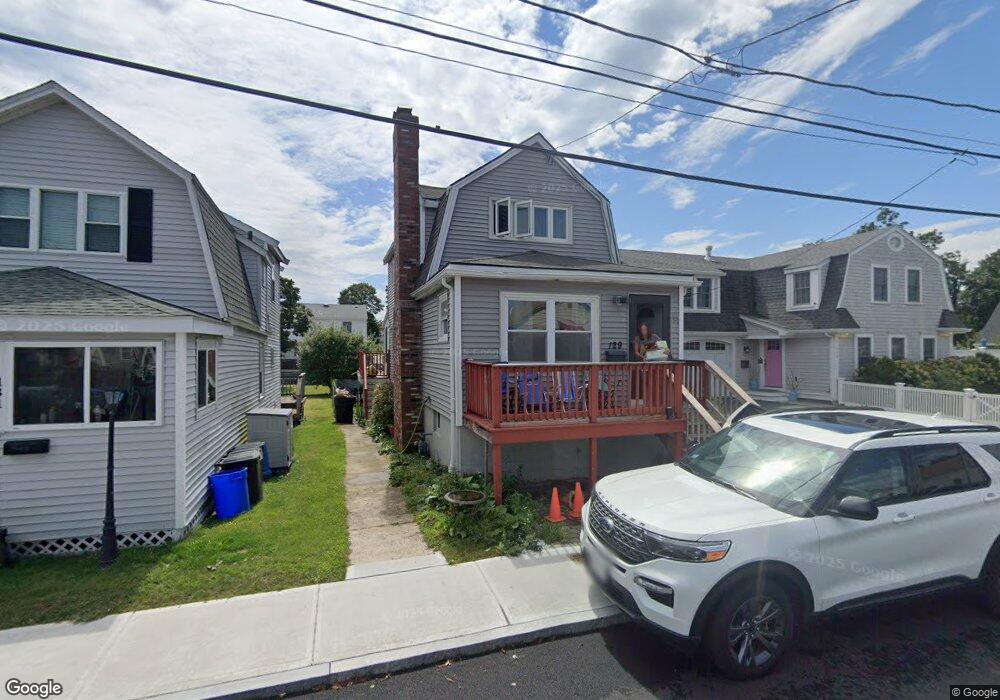
129 Charles St Quincy, MA 02169
Houghs Neck NeighborhoodEstimated Value: $470,000 - $629,000
3
Beds
2
Baths
1,065
Sq Ft
$499/Sq Ft
Est. Value
About This Home
This home is located at 129 Charles St, Quincy, MA 02169 and is currently estimated at $531,661, approximately $499 per square foot. 129 Charles St is a home located in Norfolk County with nearby schools including Atherton Hough Elementary School, Broad Meadows Middle School, and Quincy High School.
Ownership History
Date
Name
Owned For
Owner Type
Purchase Details
Closed on
Dec 10, 2019
Sold by
Diaz Jose L
Bought by
Diaz Nicole
Current Estimated Value
Purchase Details
Closed on
Dec 15, 2008
Sold by
Munro Catherine A and Grogan Catherine A
Bought by
Diaz Jose L
Home Financials for this Owner
Home Financials are based on the most recent Mortgage that was taken out on this home.
Original Mortgage
$252,172
Interest Rate
6.49%
Mortgage Type
Purchase Money Mortgage
Create a Home Valuation Report for This Property
The Home Valuation Report is an in-depth analysis detailing your home's value as well as a comparison with similar homes in the area
Home Values in the Area
Average Home Value in this Area
Purchase History
| Date | Buyer | Sale Price | Title Company |
|---|---|---|---|
| Diaz Nicole | -- | None Available | |
| Diaz Jose L | $255,500 | -- |
Source: Public Records
Mortgage History
| Date | Status | Borrower | Loan Amount |
|---|---|---|---|
| Previous Owner | Diaz Jose L | $252,172 |
Source: Public Records
Tax History
| Year | Tax Paid | Tax Assessment Tax Assessment Total Assessment is a certain percentage of the fair market value that is determined by local assessors to be the total taxable value of land and additions on the property. | Land | Improvement |
|---|---|---|---|---|
| 2025 | $5,152 | $446,800 | $213,200 | $233,600 |
| 2024 | $4,643 | $412,000 | $193,800 | $218,200 |
| 2023 | $4,262 | $382,900 | $176,200 | $206,700 |
| 2022 | $4,233 | $353,300 | $153,200 | $200,100 |
| 2021 | $4,013 | $330,600 | $153,200 | $177,400 |
| 2020 | $3,893 | $313,200 | $153,200 | $160,000 |
| 2019 | $3,754 | $299,100 | $141,800 | $157,300 |
| 2018 | $3,540 | $265,400 | $123,300 | $142,100 |
| 2017 | $3,511 | $247,800 | $123,300 | $124,500 |
| 2016 | $3,287 | $228,900 | $112,100 | $116,800 |
| 2015 | $3,078 | $210,800 | $103,800 | $107,000 |
| 2014 | $2,953 | $198,700 | $103,800 | $94,900 |
Source: Public Records
Map
Nearby Homes
- 76 Macy St
- 106 Darrow St
- 9 Darrow St
- 107 Spring St
- 65 Winthrop St
- 202 Manet Ave
- 6 Nut Island Ave
- 930 Sea St
- 18 Allerton St
- 51 Stoughton St
- 87 Fort Point Rd
- 16 Caldwell St
- 162 Palmer St
- 10 Forbush Ave
- 599 Sea St Unit 2
- 599 Sea St Unit 1
- 9 Davids Island Rd
- 104 Kings Cove Beach Rd
- 36 Palmer St
- 85 Kings Cove Beach Rd
- 131 Charles St
- 121 Charles St
- 125 Charles St
- 57 Edgewater Dr
- 59 Edgewater Dr
- 55 Edgewater Dr
- 130 Turner St
- 128 Turner St
- 61 Edgewater Dr
- 126 Turner St
- 134 Charles St
- 130 Charles St
- 118 Turner St Unit 1
- 120 Turner St
- 126 Charles St
- 122 Charles St
- 113 Charles St
- 45 Edgewater Dr
- 116 Turner St Unit 1
- 116 Turner St
Your Personal Tour Guide
Ask me questions while you tour the home.