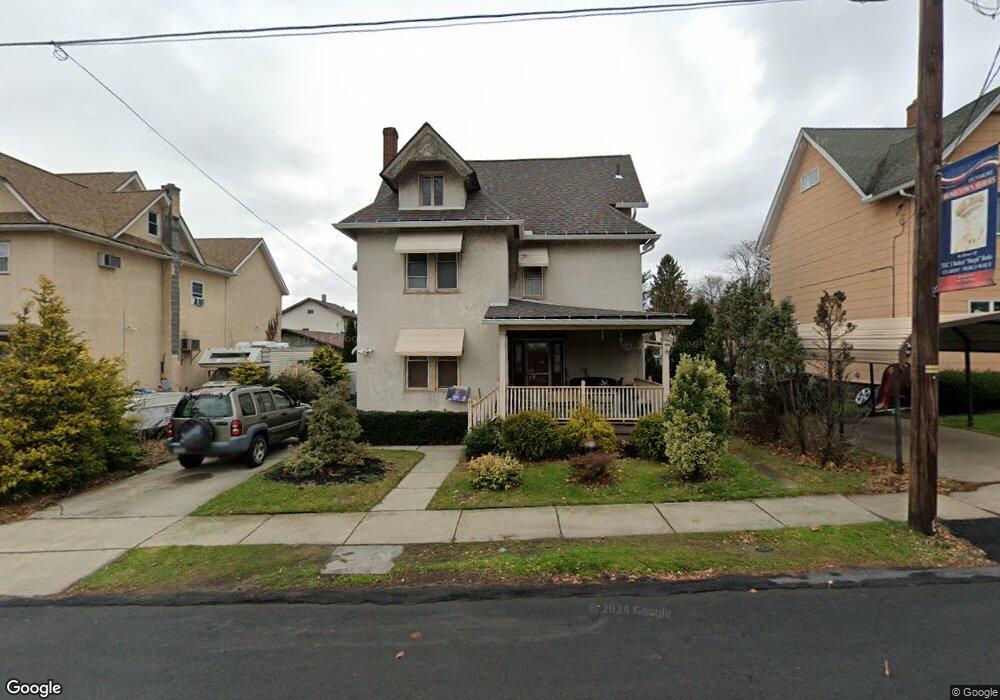
129 Cherry St Dunmore, PA 18512
Estimated Value: $187,148 - $250,000
3
Beds
2
Baths
1,700
Sq Ft
$133/Sq Ft
Est. Value
About This Home
This home is located at 129 Cherry St, Dunmore, PA 18512 and is currently estimated at $226,787, approximately $133 per square foot. 129 Cherry St is a home located in Lackawanna County with nearby schools including Dunmore Elementary Center, St. Mary of Mount Carmel School, and St Clare/St Paul School.
Ownership History
Date
Name
Owned For
Owner Type
Purchase Details
Closed on
Dec 21, 2015
Sold by
Burke Timothy M and Cieciorka Carmela M
Bought by
Burke Timothy M and Carmela M Burke `
Current Estimated Value
Home Financials for this Owner
Home Financials are based on the most recent Mortgage that was taken out on this home.
Original Mortgage
$103,000
Outstanding Balance
$62,872
Interest Rate
3.99%
Mortgage Type
New Conventional
Estimated Equity
$163,915
Purchase Details
Closed on
Mar 9, 2007
Sold by
Andres Marilyn and Andres Richard G
Bought by
Burke Timothy M and Cieciorka Carmela M
Home Financials for this Owner
Home Financials are based on the most recent Mortgage that was taken out on this home.
Original Mortgage
$97,425
Interest Rate
6.3%
Mortgage Type
New Conventional
Purchase Details
Closed on
Dec 13, 2005
Sold by
Klobusicky Joseph R and Klobusicky Debra L
Bought by
Amendolaro Justin and Hoban Sara
Create a Home Valuation Report for This Property
The Home Valuation Report is an in-depth analysis detailing your home's value as well as a comparison with similar homes in the area
Home Values in the Area
Average Home Value in this Area
Purchase History
| Date | Buyer | Sale Price | Title Company |
|---|---|---|---|
| Burke Timothy M | -- | None Available | |
| Burke Timothy M | $129,900 | None Available | |
| Amendolaro Justin | $105,000 | None Available |
Source: Public Records
Mortgage History
| Date | Status | Borrower | Loan Amount |
|---|---|---|---|
| Open | Burke Timothy M | $103,000 | |
| Closed | Burke Timothy M | $97,425 |
Source: Public Records
Tax History
| Year | Tax Paid | Tax Assessment Tax Assessment Total Assessment is a certain percentage of the fair market value that is determined by local assessors to be the total taxable value of land and additions on the property. | Land | Improvement |
|---|---|---|---|---|
| 2025 | $3,283 | $11,000 | $1,250 | $9,750 |
| 2024 | $2,807 | $11,000 | $1,250 | $9,750 |
| 2023 | $2,807 | $11,000 | $1,250 | $9,750 |
| 2022 | $2,633 | $11,000 | $1,250 | $9,750 |
| 2021 | $2,580 | $11,000 | $1,250 | $9,750 |
| 2020 | $2,580 | $11,000 | $1,250 | $9,750 |
| 2019 | $2,468 | $11,000 | $1,250 | $9,750 |
| 2018 | $2,427 | $11,000 | $1,250 | $9,750 |
| 2017 | $2,357 | $11,000 | $1,250 | $9,750 |
| 2016 | $1,130 | $11,000 | $1,250 | $9,750 |
| 2015 | -- | $11,000 | $1,250 | $9,750 |
| 2014 | -- | $11,000 | $1,250 | $9,750 |
Source: Public Records
Map
Nearby Homes
- 113 E Pine St
- 113-115 E Pine St
- 709 Meade St
- 627 S Blakely St
- 640 S 642 S Blakely St
- 812 Butler St
- 1050 Prescott Ave
- 611 Chestnut St
- 2211 Ash St
- 1017 Prescott Ave
- 2025 Delaware St
- 1042 Taylor Ave
- 1406 Ash St
- 225, 233 E 301 East Drinker Stret
- 1050 Mark Ave
- 1028 N Webster Ave
- 1018 N Webster Ave
- 1210 Monroe Ave
- 113 Franklin St
- 1947 Myrtle St
Your Personal Tour Guide
Ask me questions while you tour the home.