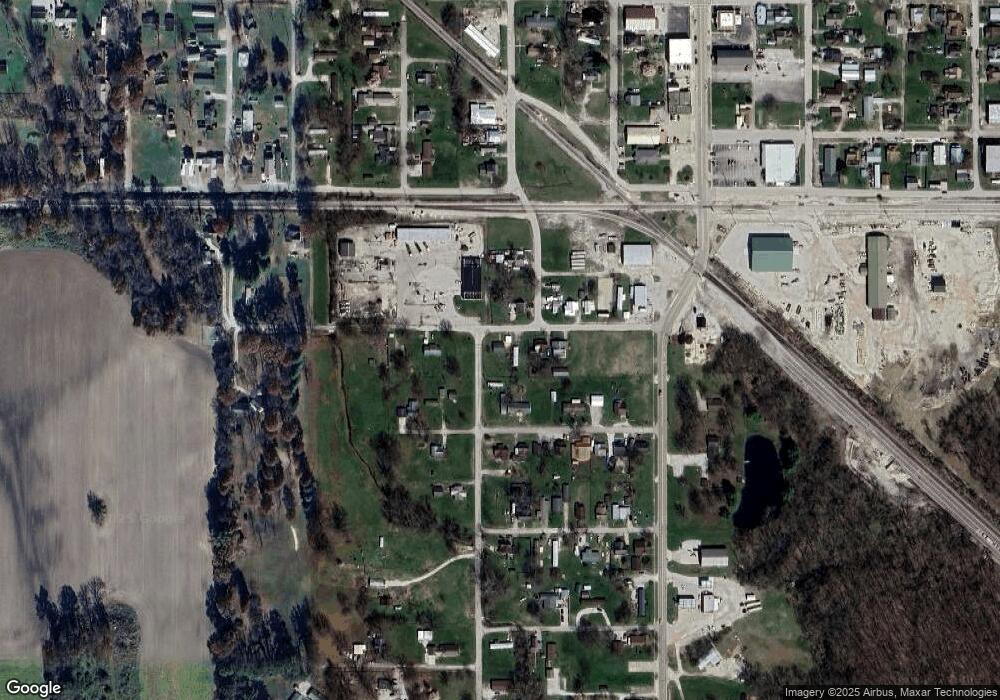
129 D St SW Linton, IN 47441
Estimated Value: $56,000 - $98,808
2
Beds
1
Bath
784
Sq Ft
$94/Sq Ft
Est. Value
About This Home
This home is located at 129 D St SW, Linton, IN 47441 and is currently estimated at $73,936, approximately $94 per square foot. 129 D St SW is a home located in Greene County with nearby schools including Linton-Stockton Elementary School, Linton-Stockton Junior High School, and Linton-Stockton High School.
Ownership History
Date
Name
Owned For
Owner Type
Purchase Details
Closed on
Aug 9, 2023
Sold by
Fagg Paul J and Fagg Kathlyn J
Bought by
Fusco John C and Fusco Katherine A
Current Estimated Value
Purchase Details
Closed on
May 19, 2021
Sold by
Hall Tyler C
Bought by
Fagg Paul J and Fagg Kathlyn J
Purchase Details
Closed on
May 11, 2021
Sold by
Sexton Gloria J
Bought by
Fagg Paul J and Fagg Kathlyn J
Create a Home Valuation Report for This Property
The Home Valuation Report is an in-depth analysis detailing your home's value as well as a comparison with similar homes in the area
Home Values in the Area
Average Home Value in this Area
Purchase History
| Date | Buyer | Sale Price | Title Company |
|---|---|---|---|
| Fusco John C | $15,000 | None Listed On Document | |
| Fagg Paul J | -- | None Available | |
| Fagg Paul J | $35,124 | None Available | |
| Fagg Paul J | $35,124 | None Available |
Source: Public Records
Mortgage History
| Date | Status | Borrower | Loan Amount |
|---|---|---|---|
| Previous Owner | Boyles Gloria J | $10,000 |
Source: Public Records
Tax History Compared to Growth
Tax History
| Year | Tax Paid | Tax Assessment Tax Assessment Total Assessment is a certain percentage of the fair market value that is determined by local assessors to be the total taxable value of land and additions on the property. | Land | Improvement |
|---|---|---|---|---|
| 2024 | $330 | $31,800 | $3,500 | $28,300 |
| 2023 | $317 | $31,500 | $3,500 | $28,000 |
| 2022 | $332 | $32,400 | $3,500 | $28,900 |
| 2021 | $220 | $30,200 | $3,500 | $26,700 |
| 2020 | $205 | $30,200 | $3,500 | $26,700 |
| 2019 | $217 | $30,200 | $3,500 | $26,700 |
| 2018 | $210 | $30,200 | $3,500 | $26,700 |
| 2017 | $201 | $29,900 | $3,500 | $26,400 |
| 2016 | $192 | $32,200 | $3,500 | $28,700 |
| 2014 | $193 | $31,800 | $3,500 | $28,300 |
| 2013 | -- | $31,500 | $3,500 | $28,000 |
Source: Public Records
Map
Nearby Homes