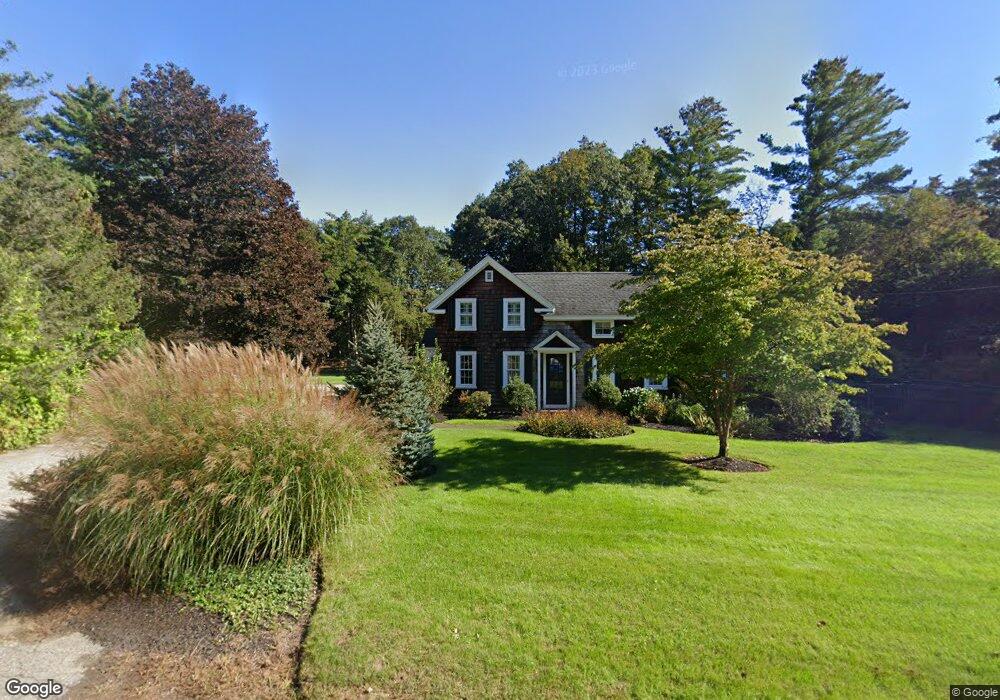
129 Depot Rd Boxford, MA 01921
Estimated Value: $511,000 - $735,000
3
Beds
3
Baths
1,954
Sq Ft
$322/Sq Ft
Est. Value
About This Home
This home is located at 129 Depot Rd, Boxford, MA 01921 and is currently estimated at $628,591, approximately $321 per square foot. 129 Depot Rd is a home located in Essex County with nearby schools including Harry Lee Cole and Spofford Pond School.
Ownership History
Date
Name
Owned For
Owner Type
Purchase Details
Closed on
Dec 29, 2021
Sold by
Rollins Christopher C
Bought by
Rollins Melissa
Current Estimated Value
Home Financials for this Owner
Home Financials are based on the most recent Mortgage that was taken out on this home.
Original Mortgage
$334,000
Outstanding Balance
$306,560
Interest Rate
3.11%
Mortgage Type
Purchase Money Mortgage
Estimated Equity
$322,031
Purchase Details
Closed on
Mar 25, 2010
Sold by
Rollins Ruth E
Bought by
Ruth E Rollins T and Rollins Ruth E
Create a Home Valuation Report for This Property
The Home Valuation Report is an in-depth analysis detailing your home's value as well as a comparison with similar homes in the area
Home Values in the Area
Average Home Value in this Area
Purchase History
| Date | Buyer | Sale Price | Title Company |
|---|---|---|---|
| Rollins Melissa | $329,000 | None Available | |
| Rollins Christopher C | -- | None Available | |
| Rollins Melissa | $329,000 | None Available | |
| Ruth E Rollins T | -- | -- | |
| Ruth E Rollins T E | -- | -- |
Source: Public Records
Mortgage History
| Date | Status | Borrower | Loan Amount |
|---|---|---|---|
| Open | Rollins Melissa | $334,000 | |
| Closed | Rollins Christopher C | $334,000 |
Source: Public Records
Tax History
| Year | Tax Paid | Tax Assessment Tax Assessment Total Assessment is a certain percentage of the fair market value that is determined by local assessors to be the total taxable value of land and additions on the property. | Land | Improvement |
|---|---|---|---|---|
| 2025 | $8,328 | $619,200 | $290,800 | $328,400 |
| 2024 | $7,908 | $606,000 | $290,800 | $315,200 |
| 2023 | $7,499 | $541,800 | $259,600 | $282,200 |
| 2022 | $7,085 | $465,500 | $216,300 | $249,200 |
| 2021 | $6,843 | $427,400 | $196,700 | $230,700 |
| 2020 | $6,753 | $417,600 | $196,700 | $220,900 |
| 2019 | $6,297 | $386,800 | $187,300 | $199,500 |
| 2018 | $6,104 | $376,800 | $187,300 | $189,500 |
| 2017 | $5,842 | $358,200 | $178,300 | $179,900 |
| 2016 | $5,791 | $351,800 | $178,300 | $173,500 |
| 2015 | $5,400 | $337,700 | $178,300 | $159,400 |
Source: Public Records
Map
Nearby Homes
- 53 Woodcrest Rd
- 5 Comstock Ln
- 24 Appleton Ln
- 5 Cobblers Ln
- 534 Ipswich Rd
- 30 Surrey Ln
- 85 Townsend Farm Rd
- 18 Boxford Rd
- 870 Haverhill St Unit 2B
- 870 Haverhill St Unit 23
- 378 Linebrook Rd
- Lot 2 (31) Lawrence Rd
- 40 Curtis Rd
- 12 Campmeeting Rd
- 7 Hickory Ln
- 17 Ice Pond Dr
- 37 Moonpenny Dr
- 3 Antoria Way
- 10 Fairway Dr Unit 10
- 16 Fairway Dr Unit 16
Your Personal Tour Guide
Ask me questions while you tour the home.