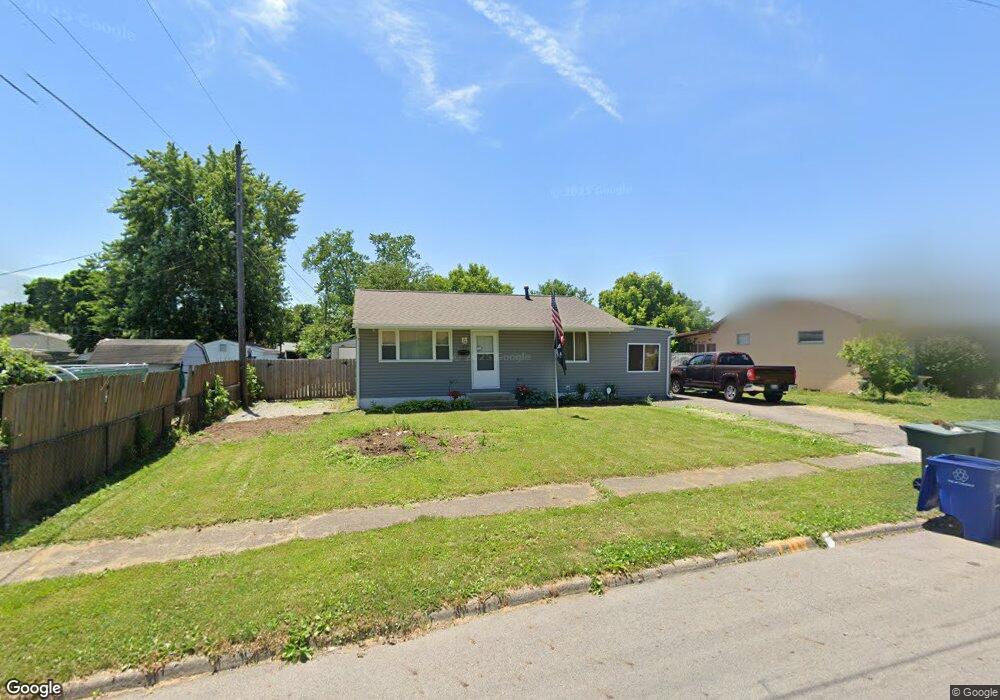
129 E Alcott Rd Columbus, OH 43207
Obetz-Lockbourne NeighborhoodEstimated Value: $194,000 - $272,000
3
Beds
1
Bath
924
Sq Ft
$241/Sq Ft
Est. Value
About This Home
This home is located at 129 E Alcott Rd, Columbus, OH 43207 and is currently estimated at $222,794, approximately $241 per square foot. 129 E Alcott Rd is a home located in Franklin County with nearby schools including Parsons Elementary School, Buckeye Middle School, and Marion-Franklin High School.
Ownership History
Date
Name
Owned For
Owner Type
Purchase Details
Closed on
Mar 31, 2014
Sold by
Pathways Financial Cu
Bought by
Jones Robert R
Current Estimated Value
Home Financials for this Owner
Home Financials are based on the most recent Mortgage that was taken out on this home.
Original Mortgage
$135,600
Outstanding Balance
$101,869
Interest Rate
4.34%
Mortgage Type
Credit Line Revolving
Estimated Equity
$120,925
Purchase Details
Closed on
Dec 11, 2013
Sold by
Osborne Margaret
Bought by
Pathways Financial Credit Union and Western Credit Union
Purchase Details
Closed on
Mar 20, 2006
Sold by
Estate Of William G Osborne
Bought by
Osborne Margaret
Purchase Details
Closed on
Dec 24, 1963
Bought by
Osborne William G
Create a Home Valuation Report for This Property
The Home Valuation Report is an in-depth analysis detailing your home's value as well as a comparison with similar homes in the area
Home Values in the Area
Average Home Value in this Area
Purchase History
| Date | Buyer | Sale Price | Title Company |
|---|---|---|---|
| Jones Robert R | $35,000 | Independent Title Box | |
| Pathways Financial Credit Union | $46,000 | None Available | |
| Osborne Margaret | -- | None Available | |
| Osborne William G | -- | -- |
Source: Public Records
Mortgage History
| Date | Status | Borrower | Loan Amount |
|---|---|---|---|
| Open | Jones Robert R | $135,600 |
Source: Public Records
Tax History
| Year | Tax Paid | Tax Assessment Tax Assessment Total Assessment is a certain percentage of the fair market value that is determined by local assessors to be the total taxable value of land and additions on the property. | Land | Improvement |
|---|---|---|---|---|
| 2025 | $2,739 | $70,670 | $18,800 | $51,870 |
| 2024 | $2,739 | $70,670 | $18,800 | $51,870 |
| 2023 | $3,138 | $70,670 | $18,800 | $51,870 |
| 2022 | $2,244 | $43,160 | $12,920 | $30,240 |
| 2021 | $2,248 | $43,160 | $12,920 | $30,240 |
| 2020 | $2,251 | $43,160 | $12,920 | $30,240 |
| 2019 | $2,293 | $37,700 | $11,240 | $26,460 |
| 2018 | $1,943 | $36,930 | $11,240 | $25,690 |
| 2017 | $1,902 | $33,010 | $11,240 | $21,770 |
| 2016 | $1,802 | $27,200 | $8,330 | $18,870 |
| 2015 | $1,689 | $26,570 | $8,330 | $18,240 |
| 2014 | $1,647 | $26,570 | $8,330 | $18,240 |
| 2013 | $571 | $27,965 | $8,785 | $19,180 |
Source: Public Records
Map
Nearby Homes
- 212 E Alcott Rd
- 19 E Castle Rd
- 84 Betz Rd
- 272 Southard Dr
- 2501 S 6th St
- 211 Delaney Dr
- 253 Benfield Ave
- 162 Phelps Rd
- 228 Currier Dr
- 2382 S 6th St
- 3127 Parsons Ave
- 460 Coulter Ave
- 3204 Lee Ellen Place
- 1633-1635 E Greenway Ave
- 83 Rumsey Rd
- 611 Lock Ave
- 3458 S 8th St
- 546 Stambaugh Ave
- 3251 Hilock Ct
- 780 Basswood Rd
- 123 E Alcott Rd
- 2751 Eastman Ave
- 2757 Eastman Ave
- 0 E Alcott Rd
- 139 E Alcott Rd
- 2763 Eastman Ave
- 111 E Alcott Rd
- 130 Cullman Rd
- 126 Cullman Rd
- 122 Cullman Rd
- 130 E Alcott Rd
- 118 E Alcott Rd
- 140 E Alcott Rd
- 0 E Alcott Rd
- 140 Cullman Rd
- 91 E Alcott Rd
- 112 Cullman Rd
- 2721 Eastman Ave
- 157 E Alcott Rd
- 112 E Alcott Rd
Your Personal Tour Guide
Ask me questions while you tour the home.