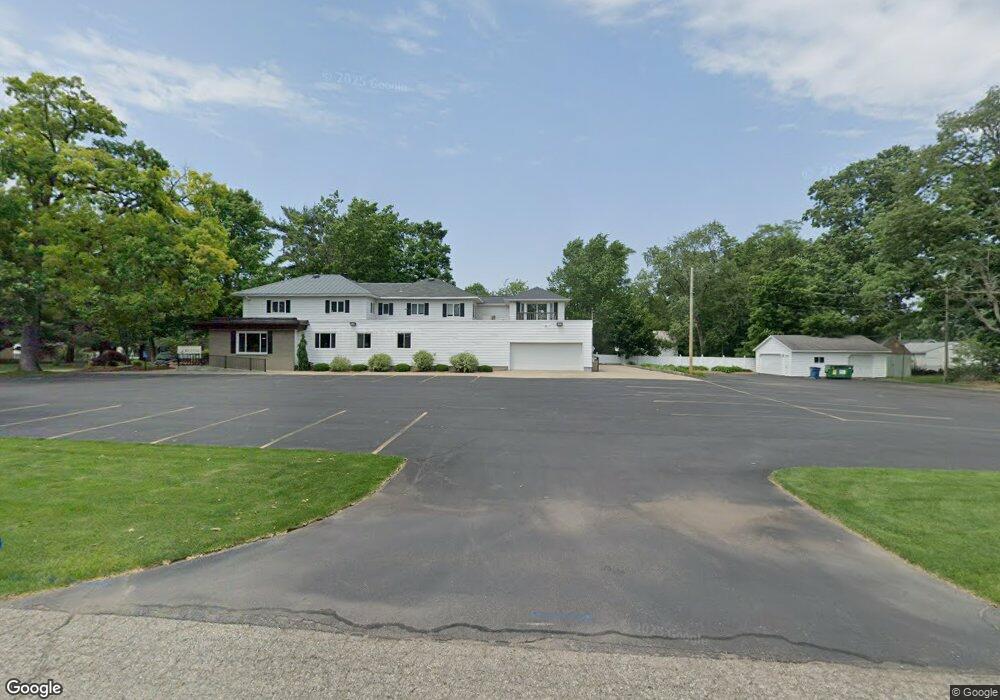
129 E Cherry St Wayland, MI 49348
Estimated Value: $304,269 - $332,000
4
Beds
2
Baths
1
Sq Ft
$317,817/Sq Ft
Est. Value
About This Home
This home is located at 129 E Cherry St, Wayland, MI 49348 and is currently estimated at $317,817, approximately $317,817 per square foot. 129 E Cherry St is a home located in Allegan County with nearby schools including Wayland High School and St. Therese Catholic School.
Ownership History
Date
Name
Owned For
Owner Type
Purchase Details
Closed on
Dec 2, 2010
Sold by
Weeden Thomas E and Weeden Joyce A
Bought by
Weeden Thomas E and Weeden Joyce A
Current Estimated Value
Purchase Details
Closed on
Apr 30, 2001
Sold by
Willcox William Brester
Bought by
Weeden Thomas E and Weeden Joyce A
Home Financials for this Owner
Home Financials are based on the most recent Mortgage that was taken out on this home.
Original Mortgage
$102,400
Outstanding Balance
$38,123
Interest Rate
6.99%
Estimated Equity
$279,694
Purchase Details
Closed on
Nov 30, 1999
Sold by
Willcox Brewster W and Willcox Mary
Bought by
Trusts Willcox W and Trusts M
Create a Home Valuation Report for This Property
The Home Valuation Report is an in-depth analysis detailing your home's value as well as a comparison with similar homes in the area
Home Values in the Area
Average Home Value in this Area
Purchase History
| Date | Buyer | Sale Price | Title Company |
|---|---|---|---|
| Weeden Thomas E | -- | None Available | |
| Weeden Thomas E | $127,000 | Michigan Bankers Title Of We | |
| Weeden Thomas A | -- | Michigan Bankers Title Of We | |
| Trusts Willcox W | -- | -- |
Source: Public Records
Mortgage History
| Date | Status | Borrower | Loan Amount |
|---|---|---|---|
| Open | Weeden Thomas A | $102,400 |
Source: Public Records
Tax History
| Year | Tax Paid | Tax Assessment Tax Assessment Total Assessment is a certain percentage of the fair market value that is determined by local assessors to be the total taxable value of land and additions on the property. | Land | Improvement |
|---|---|---|---|---|
| 2025 | $2,617 | $141,500 | $17,600 | $123,900 |
| 2024 | $2,378 | $128,100 | $14,100 | $114,000 |
| 2023 | $2,378 | $90,000 | $12,100 | $77,900 |
| 2022 | $2,378 | $80,100 | $13,100 | $67,000 |
| 2020 | $2,227 | $69,000 | $12,400 | $56,600 |
| 2019 | $0 | $65,900 | $10,900 | $55,000 |
| 2018 | $0 | $69,700 | $10,900 | $58,800 |
| 2017 | $0 | $71,000 | $10,900 | $60,100 |
| 2016 | $0 | $58,400 | $9,100 | $49,300 |
| 2015 | -- | $58,400 | $9,100 | $49,300 |
| 2014 | -- | $51,700 | $9,100 | $42,600 |
| 2013 | -- | $45,200 | $9,100 | $36,100 |
Source: Public Records
Map
Nearby Homes
- 545 N Main St
- 409 W Maple St
- 203 Vine St
- 146 Hanlon Ct
- 110 E Sycamore St
- 1033 Aster St
- 401 Anderson Dr
- 3770 Division Ave S
- 1137 Regina Trail
- 535 135th Ave
- 1146 Saskatoon Trail
- 329 Lotz Ct
- 986 129th Ave
- 4243 Butternut Dr
- 4245 Butternut Dr
- 4249 Butternut Dr
- Lot 120 Old Farm Dr
- 4279 Highpoint Dr
- 4273 Highpoint Dr Unit 112
- 4269 Highpoint Dr Unit 114
Your Personal Tour Guide
Ask me questions while you tour the home.