
129 E Cypress Ave Redlands, CA 92373
South Redlands Neighborhood
3
Beds
2.5
Baths
1,418
Sq Ft
$325/mo
HOA Fee
Highlights
- Private Pool
- Mountain View
- Granite Countertops
- Cope Middle School Rated A-
- English Architecture
- Built-In Features
About This Home
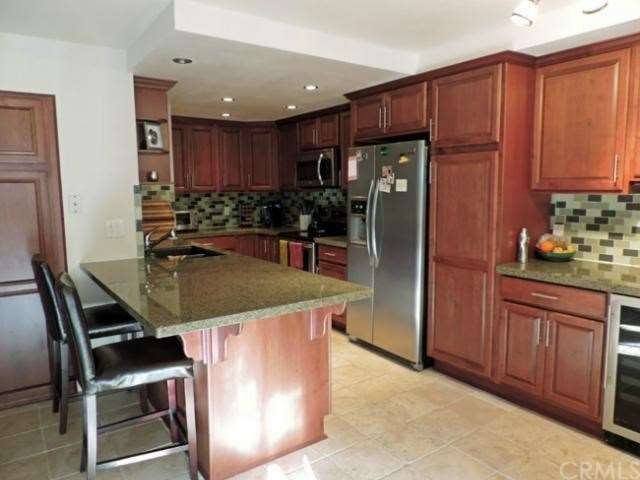
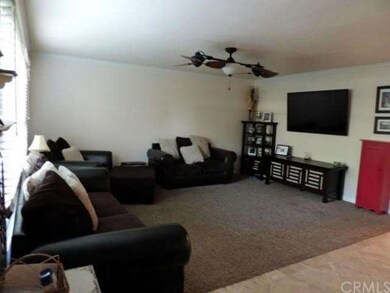
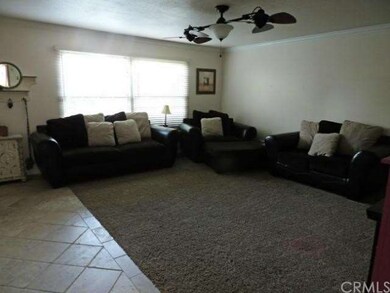
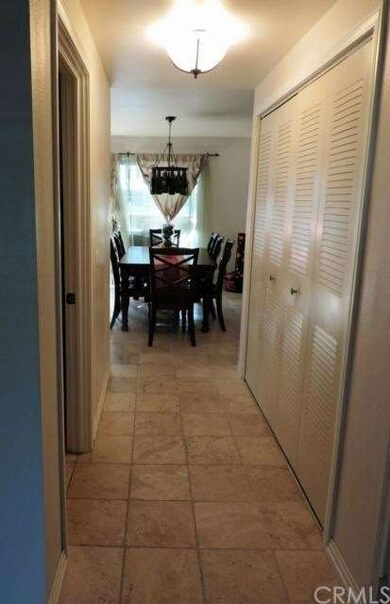
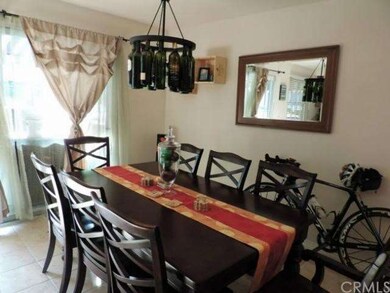
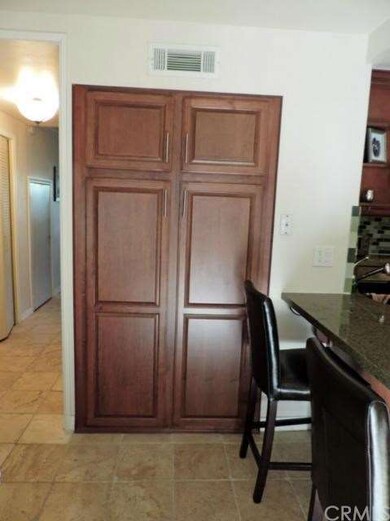
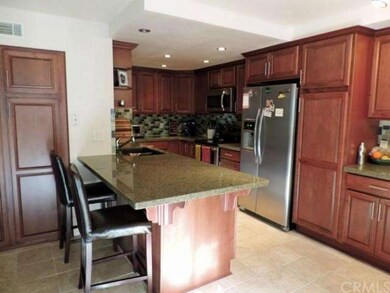
As of March 2023Completely redone 3 bedroom 2 1/2 bath two story condo/townhome in a great location! Large light and bright living room with plenty of wall space, kitchen dining room combo, all bedrooms upstairs, awning covered patio overlooks the association pool. The transformed kitchen is a must see! Complete with granite counters, stainless appliances, and a wine refrigerator. Self closing custom designed drawers and cabinets in a cherry wood finish. Tastefully selected colors for cabinetry, counter tops, tile, carpet, and paint. Remodeled bathrooms are a big plus! Interior laundry hookups, storage unit, and car port covered parking. This is an all electric home with everything almost new.
Last Agent to Sell the Property
RE/MAX ADVANTAGE License #00912862 Listed on: 04/18/2014
Townhouse Details
Home Type
- Townhome
Est. Annual Taxes
- $4,958
Year Built
- Built in 1965
Lot Details
- 1,418 Sq Ft Lot
- Two or More Common Walls
- Northeast Facing Home
HOA Fees
- $325 Monthly HOA Fees
Home Design
- English Architecture
- Turnkey
- Slab Foundation
- Asphalt Roof
- Wood Siding
- Stucco
Interior Spaces
- 1,418 Sq Ft Home
- Built-In Features
- Ceiling Fan
- Awning
- Mountain Views
- Laundry Room
Kitchen
- Breakfast Bar
- Granite Countertops
Flooring
- Carpet
- Tile
Bedrooms and Bathrooms
- 3 Bedrooms
- All Upper Level Bedrooms
Parking
- 2 Parking Spaces
- 2 Carport Spaces
- Parking Available
Additional Features
- Private Pool
- Central Heating and Cooling System
Listing and Financial Details
- Tax Lot 1
- Tax Tract Number 7255
- Assessor Parcel Number 0173401260000
Community Details
Overview
- 40 Units
- Regency HOA
Recreation
- Community Pool
Ownership History
Date
Name
Owned For
Owner Type
Purchase Details
Listed on
Nov 11, 2022
Closed on
Feb 14, 2023
Sold by
Herington Blake and Herington Alicia
Bought by
Craig Charity and Walton Elathen
Seller's Agent
RUTH SALDANA
REALTY ONE GROUP ROADS
Buyer's Agent
Natasha Peterson
Realty ONE Group West
List Price
$450,000
Sold Price
$410,000
Premium/Discount to List
-$40,000
-8.89%
Views
234
Current Estimated Value
Home Financials for this Owner
Home Financials are based on the most recent Mortgage that was taken out on this home.
Estimated Appreciation
$43,565
Avg. Annual Appreciation
4.45%
Original Mortgage
$402,573
Interest Rate
6.32%
Mortgage Type
FHA
Purchase Details
Listed on
Jul 14, 2021
Closed on
Jul 23, 2021
Sold by
Gabriel Richard T
Bought by
Herington Blake and Herington Alicia
Seller's Agent
Christopher Savare
Fiv Realty Co.
Buyer's Agent
RUTH SALDANA
REALTY ONE GROUP ROADS
List Price
$379,900
Sold Price
$400,000
Premium/Discount to List
$20,100
5.29%
Home Financials for this Owner
Home Financials are based on the most recent Mortgage that was taken out on this home.
Avg. Annual Appreciation
1.56%
Original Mortgage
$315,000
Interest Rate
2.9%
Mortgage Type
New Conventional
Purchase Details
Listed on
Jun 22, 2017
Closed on
Jul 3, 2017
Sold by
Park John and Park Michelle J Chu
Bought by
Gabriel Richard T
Seller's Agent
Carlos Gutierrez
Re/Max Champions
Buyer's Agent
MICHAEL HOKE
CALIFORNIA SUNSET REALTY
List Price
$265,000
Sold Price
$265,000
Home Financials for this Owner
Home Financials are based on the most recent Mortgage that was taken out on this home.
Avg. Annual Appreciation
10.62%
Original Mortgage
$212,000
Interest Rate
3.88%
Mortgage Type
New Conventional
Purchase Details
Listed on
Jan 6, 2017
Closed on
Apr 7, 2017
Sold by
Dumond Joseph E and Dumond Maria L
Bought by
Park John and Park Michelle J Chu
Seller's Agent
Jessica Bouzane
Berkshire Hathaway Homeservices California Realty
Buyer's Agent
Cheryl Seich
The Associates Realty Group
List Price
$299,900
Sold Price
$280,000
Premium/Discount to List
-$19,900
-6.64%
Home Financials for this Owner
Home Financials are based on the most recent Mortgage that was taken out on this home.
Original Mortgage
$205,500
Interest Rate
4.1%
Mortgage Type
New Conventional
Purchase Details
Listed on
Apr 18, 2014
Closed on
May 1, 2014
Sold by
Taube Philip Johnson and Taube Randi M
Bought by
Dumond Joseph E and Dumond Maria L
Seller's Agent
Alan Forbes
RE/MAX ADVANTAGE
Buyer's Agent
Manuel Bernal
Sunbelt Realty Services
List Price
$239,900
Sold Price
$239,000
Premium/Discount to List
-$900
-0.38%
Home Financials for this Owner
Home Financials are based on the most recent Mortgage that was taken out on this home.
Avg. Annual Appreciation
5.48%
Original Mortgage
$191,200
Interest Rate
4.23%
Mortgage Type
New Conventional
Purchase Details
Closed on
May 21, 2013
Sold by
Taube Randi M
Bought by
Taube Philip Johnson and Taube Randi M
Purchase Details
Listed on
Dec 8, 2011
Closed on
Feb 27, 2012
Sold by
Taube Philip Johnson
Bought by
Taube Randi M
Seller's Agent
JANE BLESCH
BLESCH & ASSOCIATES R. E.
Buyer's Agent
Alan Forbes
RE/MAX ADVANTAGE
List Price
$164,900
Sold Price
$154,900
Premium/Discount to List
-$10,000
-6.06%
Home Financials for this Owner
Home Financials are based on the most recent Mortgage that was taken out on this home.
Avg. Annual Appreciation
8.34%
Original Mortgage
$123,920
Interest Rate
3.83%
Mortgage Type
New Conventional
Purchase Details
Listed on
Dec 8, 2011
Closed on
Jan 23, 2012
Sold by
Wells Fargo Bank N A
Bought by
Taube Randi M
Seller's Agent
JANE BLESCH
BLESCH & ASSOCIATES R. E.
Buyer's Agent
Alan Forbes
RE/MAX ADVANTAGE
List Price
$164,900
Sold Price
$154,900
Premium/Discount to List
-$10,000
-6.06%
Home Financials for this Owner
Home Financials are based on the most recent Mortgage that was taken out on this home.
Original Mortgage
$123,920
Interest Rate
3.83%
Mortgage Type
New Conventional
Purchase Details
Closed on
Dec 7, 2011
Sold by
Hamner Vicki
Bought by
Wells Fargo Bank N A
Home Financials for this Owner
Home Financials are based on the most recent Mortgage that was taken out on this home.
Original Mortgage
$123,920
Interest Rate
3.83%
Mortgage Type
New Conventional
Purchase Details
Closed on
Apr 11, 2006
Sold by
Gury Joe
Bought by
Hamner Vicki
Home Financials for this Owner
Home Financials are based on the most recent Mortgage that was taken out on this home.
Original Mortgage
$58,200
Interest Rate
6.46%
Mortgage Type
Stand Alone Second
Purchase Details
Closed on
Sep 3, 1998
Sold by
Griffin Bernice
Bought by
Gury Joe
Home Financials for this Owner
Home Financials are based on the most recent Mortgage that was taken out on this home.
Original Mortgage
$86,400
Interest Rate
6.93%
Mortgage Type
Seller Take Back
Similar Home in Redlands, CA
Create a Home Valuation Report for This Property
The Home Valuation Report is an in-depth analysis detailing your home's value as well as a comparison with similar homes in the area
Home Values in the Area
Average Home Value in this Area
Purchase History
| Date | Type | Sale Price | Title Company |
|---|---|---|---|
| Grant Deed | $410,000 | Orange Coast Title | |
| Grant Deed | $400,000 | Ticor Title | |
| Grant Deed | $265,000 | Usa National Title Co | |
| Grant Deed | $280,000 | Ticor Title Company Of Ca | |
| Grant Deed | $239,000 | Lawyers Title | |
| Interfamily Deed Transfer | -- | None Available | |
| Interfamily Deed Transfer | -- | Chicago Title Company | |
| Grant Deed | $154,900 | Servicelink | |
| Trustee Deed | $144,500 | Accommodation | |
| Grant Deed | $291,000 | Community Title Company | |
| Grant Deed | $96,000 | Orange Coast Title |
Source: Public Records
Mortgage History
| Date | Status | Loan Amount | Loan Type |
|---|---|---|---|
| Open | $403,754 | FHA | |
| Closed | $402,573 | FHA | |
| Previous Owner | $315,000 | New Conventional | |
| Previous Owner | $232,000 | New Conventional | |
| Previous Owner | $212,000 | New Conventional | |
| Previous Owner | $205,500 | New Conventional | |
| Previous Owner | $191,200 | New Conventional | |
| Previous Owner | $123,920 | New Conventional | |
| Previous Owner | $99,700 | Stand Alone Second | |
| Previous Owner | $58,200 | Stand Alone Second | |
| Previous Owner | $232,800 | Purchase Money Mortgage | |
| Previous Owner | $86,400 | Seller Take Back |
Source: Public Records
Property History
| Date | Event | Price | Change | Sq Ft Price |
|---|---|---|---|---|
| 03/29/2023 03/29/23 | Sold | $410,000 | -1.2% | $289 / Sq Ft |
| 02/13/2023 02/13/23 | Pending | -- | -- | -- |
| 01/28/2023 01/28/23 | Price Changed | $414,999 | -3.0% | $293 / Sq Ft |
| 01/02/2023 01/02/23 | Price Changed | $427,999 | -4.5% | $302 / Sq Ft |
| 11/27/2022 11/27/22 | Price Changed | $447,999 | -0.4% | $316 / Sq Ft |
| 11/11/2022 11/11/22 | For Sale | $450,000 | +12.5% | $317 / Sq Ft |
| 08/23/2021 08/23/21 | Sold | $400,000 | +5.3% | $282 / Sq Ft |
| 07/14/2021 07/14/21 | For Sale | $379,900 | +43.4% | $268 / Sq Ft |
| 07/27/2017 07/27/17 | Sold | $265,000 | 0.0% | $175 / Sq Ft |
| 06/22/2017 06/22/17 | For Sale | $265,000 | -5.4% | $175 / Sq Ft |
| 05/17/2017 05/17/17 | Sold | $280,000 | -5.1% | $197 / Sq Ft |
| 04/03/2017 04/03/17 | Pending | -- | -- | -- |
| 03/22/2017 03/22/17 | Price Changed | $295,000 | -1.6% | $208 / Sq Ft |
| 01/06/2017 01/06/17 | For Sale | $299,900 | +25.5% | $211 / Sq Ft |
| 05/30/2014 05/30/14 | Sold | $239,000 | -0.4% | $169 / Sq Ft |
| 04/18/2014 04/18/14 | For Sale | $239,900 | +54.9% | $169 / Sq Ft |
| 03/01/2012 03/01/12 | Sold | $154,900 | 0.0% | $109 / Sq Ft |
| 01/18/2012 01/18/12 | Pending | -- | -- | -- |
| 01/17/2012 01/17/12 | Off Market | $154,900 | -- | -- |
| 01/09/2012 01/09/12 | Price Changed | $159,900 | -3.0% | $113 / Sq Ft |
| 12/08/2011 12/08/11 | For Sale | $164,900 | -- | $116 / Sq Ft |
Source: California Regional Multiple Listing Service (CRMLS)
Tax History Compared to Growth
Tax History
| Year | Tax Paid | Tax Assessment Tax Assessment Total Assessment is a certain percentage of the fair market value that is determined by local assessors to be the total taxable value of land and additions on the property. | Land | Improvement |
|---|---|---|---|---|
| 2025 | $4,958 | $426,564 | $127,969 | $298,595 |
| 2024 | $4,958 | $418,200 | $125,460 | $292,740 |
| 2023 | $4,929 | $408,000 | $122,400 | $285,600 |
| 2022 | $4,857 | $400,000 | $120,000 | $280,000 |
| 2021 | $3,527 | $278,562 | $83,569 | $194,993 |
| 2020 | $3,474 | $275,706 | $82,712 | $192,994 |
| 2019 | $3,377 | $270,300 | $81,090 | $189,210 |
| 2018 | $3,293 | $265,000 | $79,500 | $185,500 |
| 2017 | $3,088 | $252,443 | $75,733 | $176,710 |
| 2016 | $3,052 | $247,493 | $74,248 | $173,245 |
| 2015 | $3,028 | $243,776 | $73,133 | $170,643 |
| 2014 | $2,047 | $158,716 | $25,616 | $133,100 |
Source: Public Records
Agents Affiliated with this Home
-
R
Seller's Agent in 2023
RUTH SALDANA
REALTY ONE GROUP ROADS
-
N
Buyer's Agent in 2023
Natasha Peterson
Realty ONE Group West
(951) 547-8400
1 in this area
15 Total Sales
-
Seller's Agent in 2021
Christopher Savare
Fiv Realty Co.
(844) 489-1240
1 in this area
50 Total Sales
-
Seller Co-Listing Agent in 2021
Nazar Kalayji
Fiv Realty Co.
(714) 337-6286
1 in this area
515 Total Sales
-
Seller's Agent in 2017
Carlos Gutierrez
RE/MAX
(951) 522-8059
10 in this area
114 Total Sales
-
Seller's Agent in 2017
Jessica Bouzane
Berkshire Hathaway Homeservices California Realty
(909) 345-0909
11 in this area
109 Total Sales
Map
Source: California Regional Multiple Listing Service (CRMLS)
MLS Number: EV14079620
APN: 0173-401-26
Disclaimer: Certain information contained herein is derived from information provided by parties other than Homes.com. All information provided is deemed reliable, but is not guaranteed to be accurate and should be independently verified.
![]() The multiple listing data appearing on this website, or contained in reports produced therefrom, is owned and copyrighted by California Regional Multiple Listing Service, Inc. ("CRMLS") and is protected by all applicable copyright laws. Information provided is for viewer's personal, non-commercial use and may not be used for any purpose other than to identify prospective properties the viewer may be interested in purchasing. All listing data, including but not limited to square footage and lot size is believed to be accurate, but the listing Agent, listing Broker and CRMLS and its affiliates do not warrant or guarantee such accuracy. The viewer should independently verify the listed data prior to making any decisions based on such information by personal inspection and/or contacting a real estate professional.
The multiple listing data appearing on this website, or contained in reports produced therefrom, is owned and copyrighted by California Regional Multiple Listing Service, Inc. ("CRMLS") and is protected by all applicable copyright laws. Information provided is for viewer's personal, non-commercial use and may not be used for any purpose other than to identify prospective properties the viewer may be interested in purchasing. All listing data, including but not limited to square footage and lot size is believed to be accurate, but the listing Agent, listing Broker and CRMLS and its affiliates do not warrant or guarantee such accuracy. The viewer should independently verify the listed data prior to making any decisions based on such information by personal inspection and/or contacting a real estate professional.
Based on information from California Regional Multiple Listing Service, Inc. and /or other sources. All data, including all measurements and calculations of area, is obtained from various sources and has not been, and will not be, verified by broker or MLS. All information should be independently reviewed and verified for accuracy. Properties may or may not be listed by the office/agent presenting the information
Nearby Homes
- 101 E Cypress Ave
- 571 La Verne St
- 434 Sonora Cir
- 242 E Fern Ave Unit 206
- 242 E Fern Ave Unit 208
- 238 E Fern Ave Unit 204
- 246 E Fern Ave Unit 210
- 254 E Fern Ave
- 254 E Fern Ave Unit 108
- 254 E Fern Ave Unit 207
- 331 Nordina St
- 316 Sonora St
- 302 Sonora St
- 625 Alvarado St
- 670 E Palm Ave
- 304 S Eureka St
- 108 W Olive Ave
- 529 Esther Way
- 120 W Olive Ave
- 305 W Olive Ave