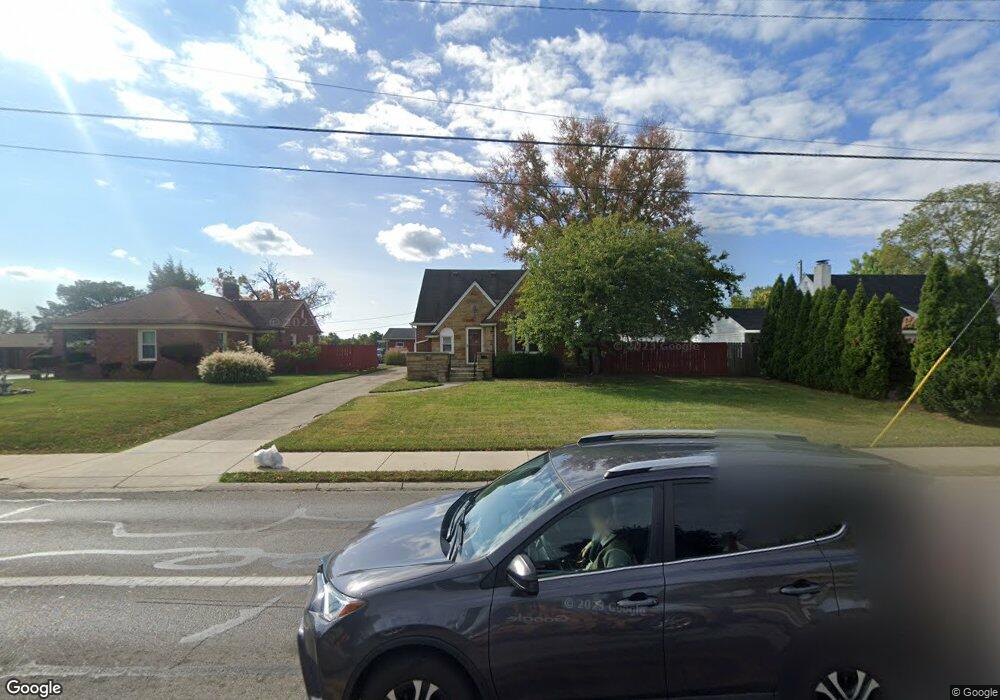
129 E Home Rd Springfield, OH 45504
Estimated Value: $220,000 - $255,000
3
Beds
2
Baths
1,705
Sq Ft
$139/Sq Ft
Est. Value
About This Home
This home is located at 129 E Home Rd, Springfield, OH 45504 and is currently estimated at $236,333, approximately $138 per square foot. 129 E Home Rd is a home located in Clark County with nearby schools including Snowhill Elementary School, Roosevelt Middle School, and Springfield High School.
Ownership History
Date
Name
Owned For
Owner Type
Purchase Details
Closed on
Feb 11, 2002
Sold by
Conetta James D and Conetta Hollie R
Bought by
Craig Bryan D
Current Estimated Value
Home Financials for this Owner
Home Financials are based on the most recent Mortgage that was taken out on this home.
Original Mortgage
$114,594
Outstanding Balance
$46,502
Interest Rate
7.24%
Mortgage Type
FHA
Estimated Equity
$189,831
Purchase Details
Closed on
Apr 20, 2001
Sold by
Page Ted A and Page Beth A
Bought by
Conetta James D and Conetta Hollie R
Home Financials for this Owner
Home Financials are based on the most recent Mortgage that was taken out on this home.
Original Mortgage
$96,900
Interest Rate
6.95%
Mortgage Type
Purchase Money Mortgage
Purchase Details
Closed on
Dec 5, 1994
Sold by
Culley Carey P
Bought by
Page Ted A and Page Beth
Home Financials for this Owner
Home Financials are based on the most recent Mortgage that was taken out on this home.
Original Mortgage
$64,000
Interest Rate
8.91%
Mortgage Type
New Conventional
Create a Home Valuation Report for This Property
The Home Valuation Report is an in-depth analysis detailing your home's value as well as a comparison with similar homes in the area
Home Values in the Area
Average Home Value in this Area
Purchase History
| Date | Buyer | Sale Price | Title Company |
|---|---|---|---|
| Craig Bryan D | $115,500 | -- | |
| Conetta James D | $102,000 | -- | |
| Page Ted A | $80,000 | -- |
Source: Public Records
Mortgage History
| Date | Status | Borrower | Loan Amount |
|---|---|---|---|
| Open | Craig Bryan D | $114,594 | |
| Previous Owner | Conetta James D | $96,900 | |
| Previous Owner | Page Ted A | $64,000 |
Source: Public Records
Tax History
| Year | Tax Paid | Tax Assessment Tax Assessment Total Assessment is a certain percentage of the fair market value that is determined by local assessors to be the total taxable value of land and additions on the property. | Land | Improvement |
|---|---|---|---|---|
| 2025 | $2,408 | $68,200 | $11,230 | $56,970 |
| 2024 | $2,346 | $48,670 | $10,110 | $38,560 |
| 2023 | $2,346 | $48,670 | $10,110 | $38,560 |
| 2022 | $7,349 | $48,670 | $10,110 | $38,560 |
| 2021 | $2,086 | $39,020 | $8,020 | $31,000 |
| 2020 | $2,091 | $39,020 | $8,020 | $31,000 |
| 2019 | $2,096 | $39,020 | $8,020 | $31,000 |
| 2018 | $2,087 | $37,270 | $8,020 | $29,250 |
| 2017 | $2,086 | $35,378 | $8,022 | $27,356 |
| 2016 | $2,089 | $35,378 | $8,022 | $27,356 |
| 2015 | $2,211 | $37,121 | $8,022 | $29,099 |
| 2014 | $2,202 | $37,121 | $8,022 | $29,099 |
| 2013 | $2,178 | $37,121 | $8,022 | $29,099 |
Source: Public Records
Map
Nearby Homes
- 0 E Home Rd
- 141 S Kensington Place
- 2438 Signal Hill Rd
- 154 Floral Ave
- 110 S Broadmoor Blvd
- 1810 N Limestone St
- 366 Northfield Blvd Unit 1C
- 25 Englewood Rd
- 1718 Northpoint Rd
- 327 Ardmore Rd
- 2824 Balsam Dr
- 329 Roosevelt Dr
- 224 Roscommon Dr
- 125 Hawthorne Rd
- 2524 Home Orchard Dr
- 310 E 3rd St
- 2153 Olympic St Unit 2153
- 2951 Archer Ln
- 308 Ridge Rd
- 364 Ridge Rd
- 2245 N Limestone St
- 121 E Home Rd
- 130 E Home Rd
- 124 E Home Rd
- 136 E Home Rd
- 2250 N Limestone St
- 2230 Shawnee Blvd
- 120 E Home Rd
- 101 E Home Rd
- 2226 Shawnee Blvd
- 110 E Home Rd
- 2222 Shawnee Blvd
- 102 E Home Rd
- 2301 N Limestone St
- 2213 N Limestone St
- 25 E Home Rd
- 120 Trenton Place
- 2322 Shawnee Blvd
- 2303 N Limestone St
- 110 Trenton Place
Your Personal Tour Guide
Ask me questions while you tour the home.