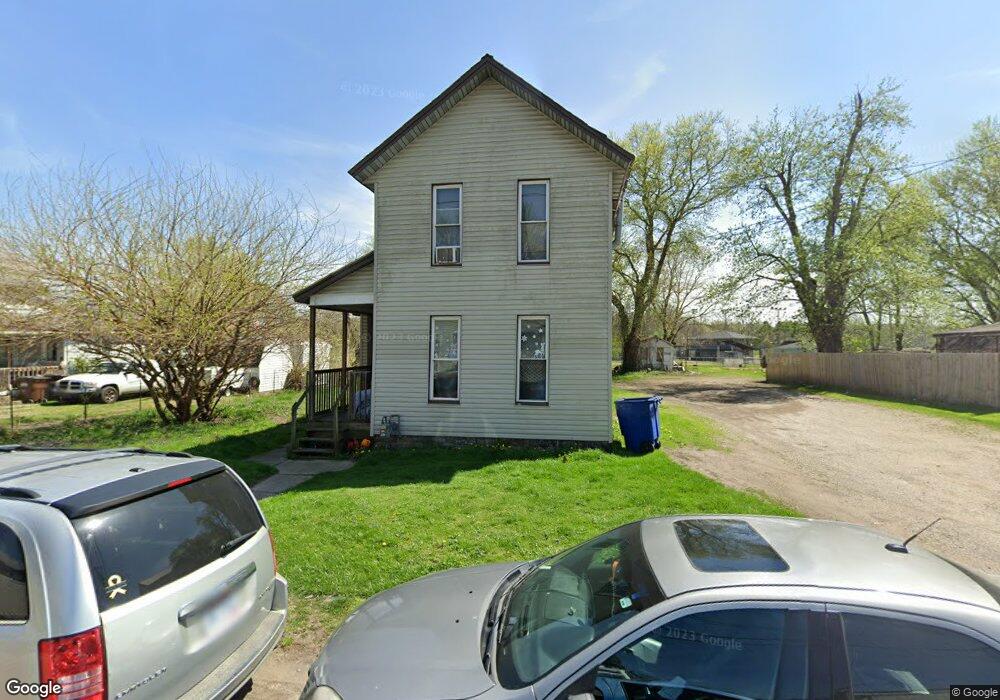
129 Fleek Ave Newark, OH 43055
Estimated Value: $74,000 - $114,000
3
Beds
1
Bath
1,286
Sq Ft
$70/Sq Ft
Est. Value
About This Home
This home is located at 129 Fleek Ave, Newark, OH 43055 and is currently estimated at $89,505, approximately $69 per square foot. 129 Fleek Ave is a home located in Licking County with nearby schools including Ben Franklin Elementary School, Heritage Middle School, and Newark High School.
Ownership History
Date
Name
Owned For
Owner Type
Purchase Details
Closed on
Jan 25, 2023
Sold by
57 Neal Newark Llc
Bought by
Raveux Properties Llc
Current Estimated Value
Purchase Details
Closed on
Jan 13, 2022
Sold by
Asb Property Group Llc
Bought by
57 Neal Newark Llc
Purchase Details
Closed on
Jan 15, 2021
Sold by
Benner Travis and Benner Travis Wayne
Bought by
Asb Property Group Llc
Home Financials for this Owner
Home Financials are based on the most recent Mortgage that was taken out on this home.
Original Mortgage
$1,000,000
Interest Rate
2.65%
Mortgage Type
Commercial
Purchase Details
Closed on
Apr 3, 2007
Sold by
Collins Charlene and Hamilton Charlene Collins
Bought by
Benner Travis and Benner Travis Wayne
Create a Home Valuation Report for This Property
The Home Valuation Report is an in-depth analysis detailing your home's value as well as a comparison with similar homes in the area
Home Values in the Area
Average Home Value in this Area
Purchase History
| Date | Buyer | Sale Price | Title Company |
|---|---|---|---|
| Raveux Properties Llc | $65,000 | None Listed On Document | |
| 57 Neal Newark Llc | -- | Miller Mark S | |
| Asb Property Group Llc | $22,800 | None Available | |
| Benner Travis | -- | None Available |
Source: Public Records
Mortgage History
| Date | Status | Borrower | Loan Amount |
|---|---|---|---|
| Previous Owner | Asb Property Group Llc | $1,000,000 |
Source: Public Records
Tax History Compared to Growth
Tax History
| Year | Tax Paid | Tax Assessment Tax Assessment Total Assessment is a certain percentage of the fair market value that is determined by local assessors to be the total taxable value of land and additions on the property. | Land | Improvement |
|---|---|---|---|---|
| 2024 | $708 | $19,260 | $5,780 | $13,480 |
| 2023 | $1,026 | $19,260 | $5,780 | $13,480 |
| 2022 | $602 | $14,530 | $3,400 | $11,130 |
| 2021 | $957 | $14,460 | $3,330 | $11,130 |
| 2020 | $642 | $14,460 | $3,330 | $11,130 |
| 2019 | $539 | $11,660 | $2,380 | $9,280 |
| 2018 | $539 | $0 | $0 | $0 |
| 2017 | $562 | $0 | $0 | $0 |
| 2016 | $596 | $0 | $0 | $0 |
| 2015 | $608 | $0 | $0 | $0 |
| 2014 | $758 | $0 | $0 | $0 |
| 2013 | $581 | $0 | $0 | $0 |
Source: Public Records
Map
Nearby Homes