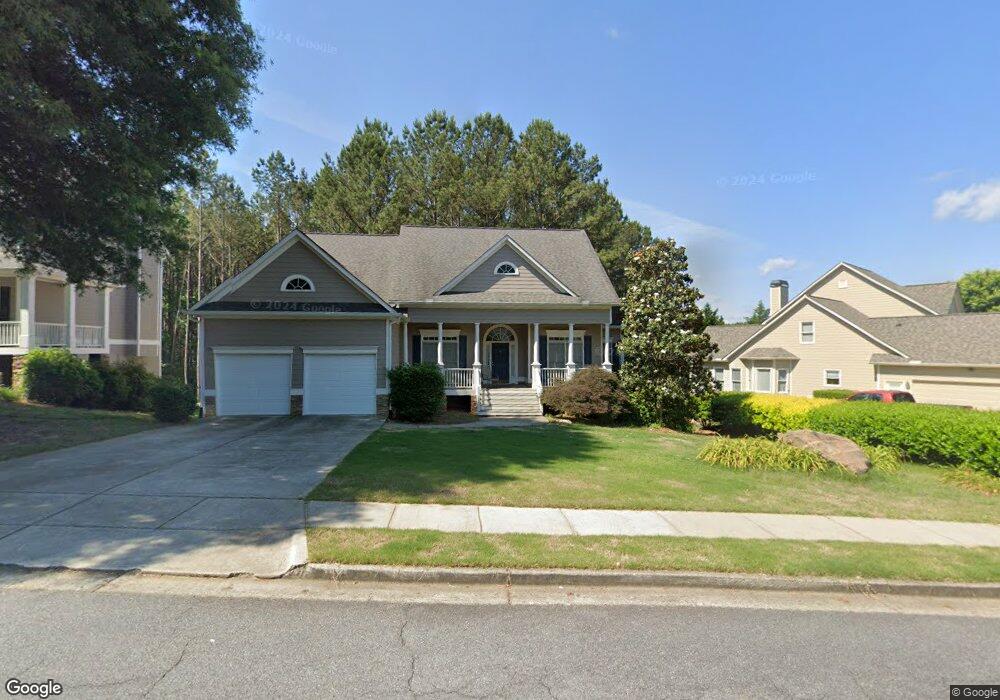
129 Golden Aster Trace Acworth, GA 30101
Cedarcrest NeighborhoodEstimated Value: $438,000 - $495,000
3
Beds
2
Baths
2,074
Sq Ft
$220/Sq Ft
Est. Value
About This Home
This home is located at 129 Golden Aster Trace, Acworth, GA 30101 and is currently estimated at $455,568, approximately $219 per square foot. 129 Golden Aster Trace is a home located in Paulding County with nearby schools including Burnt Hickory Elementary School, Sammy Mcclure Sr. Middle School, and North Paulding High School.
Ownership History
Date
Name
Owned For
Owner Type
Purchase Details
Closed on
Aug 13, 2016
Sold by
Dj J
Bought by
Cassel Amy P and Cassel Dj J
Current Estimated Value
Home Financials for this Owner
Home Financials are based on the most recent Mortgage that was taken out on this home.
Original Mortgage
$155,700
Outstanding Balance
$71,062
Interest Rate
3.42%
Estimated Equity
$384,506
Purchase Details
Closed on
Apr 9, 2007
Sold by
Black Michelle E
Bought by
Cassel Dj J
Home Financials for this Owner
Home Financials are based on the most recent Mortgage that was taken out on this home.
Original Mortgage
$199,200
Interest Rate
6.1%
Purchase Details
Closed on
Mar 28, 2002
Sold by
Morrison Homes Inc
Bought by
Black Barry W and Black Michele E
Home Financials for this Owner
Home Financials are based on the most recent Mortgage that was taken out on this home.
Original Mortgage
$180,612
Interest Rate
6.85%
Create a Home Valuation Report for This Property
The Home Valuation Report is an in-depth analysis detailing your home's value as well as a comparison with similar homes in the area
Home Values in the Area
Average Home Value in this Area
Purchase History
| Date | Buyer | Sale Price | Title Company |
|---|---|---|---|
| Cassel Amy P | -- | -- | |
| Cassel Dj J | $249,000 | -- | |
| Black Barry W | $225,800 | -- |
Source: Public Records
Mortgage History
| Date | Status | Borrower | Loan Amount |
|---|---|---|---|
| Open | Cassel Amy P | $155,700 | |
| Previous Owner | Cassel Dj J | $199,200 | |
| Previous Owner | Black Barry W | $180,612 |
Source: Public Records
Tax History Compared to Growth
Tax History
| Year | Tax Paid | Tax Assessment Tax Assessment Total Assessment is a certain percentage of the fair market value that is determined by local assessors to be the total taxable value of land and additions on the property. | Land | Improvement |
|---|---|---|---|---|
| 2024 | $4,702 | $189,016 | $26,000 | $163,016 |
| 2023 | $4,796 | $183,948 | $26,000 | $157,948 |
| 2022 | $4,037 | $154,848 | $26,000 | $128,848 |
| 2021 | $3,577 | $123,088 | $26,000 | $97,088 |
| 2020 | $3,508 | $118,108 | $26,000 | $92,108 |
| 2019 | $3,370 | $111,844 | $26,000 | $85,844 |
| 2018 | $3,147 | $104,460 | $26,000 | $78,460 |
| 2017 | $3,014 | $98,672 | $20,000 | $78,672 |
| 2016 | $2,856 | $94,460 | $20,000 | $74,460 |
| 2015 | $2,855 | $92,760 | $20,000 | $72,760 |
| 2014 | $2,878 | $91,160 | $20,000 | $71,160 |
| 2013 | -- | $73,280 | $20,000 | $53,280 |
Source: Public Records
Map
Nearby Homes
- 825 Flagstone Way
- 61 Gellmore Ln
- 1136 Flagstone Way
- 138 Knightwood Point Unit 2
- 26 Lilyfield Ln
- 291 Harmony Cir
- 134 Grove Meadow Dr
- 148 Carlton Ct
- 262 Lilyfield Ln
- 498 Remington Ln
- 9 Little Ct
- 142 Floating Leaf Way
- 197 Hickory Pointe Dr
- 115 Floating Leaf Way
- 88 Water Oak Dr
- 51 Water Oak Dr
- 56 Friendship Point
- 283 Hickory Pointe Dr
- 39 Floating Leaf Way
- 31 Friendship Point
- 159 Golden Aster Trace
- 115 Golden Aster Trace
- 191 Golden Aster Trace
- 99 Golden Aster Trace
- 203 Golden Aster Trace
- 118 Golden Aster Trace
- 136 Golden Aster Trace
- 148 Golden Aster Trace Unit 352
- 148 Golden Aster Trace
- 100 Golden Aster Trace
- 162 Golden Aster Trace
- 87 Golden Aster Trace
- 172 Golden Aster Trace Unit 1
- 80 Golden Aster Trace
- 638 Flagstone Way
- 209 Golden Aster Trace
- 622 Flagstone Way
- 654 Flagstone Way
- 186 Golden Aster Trace
- 71 Golden Aster Trace