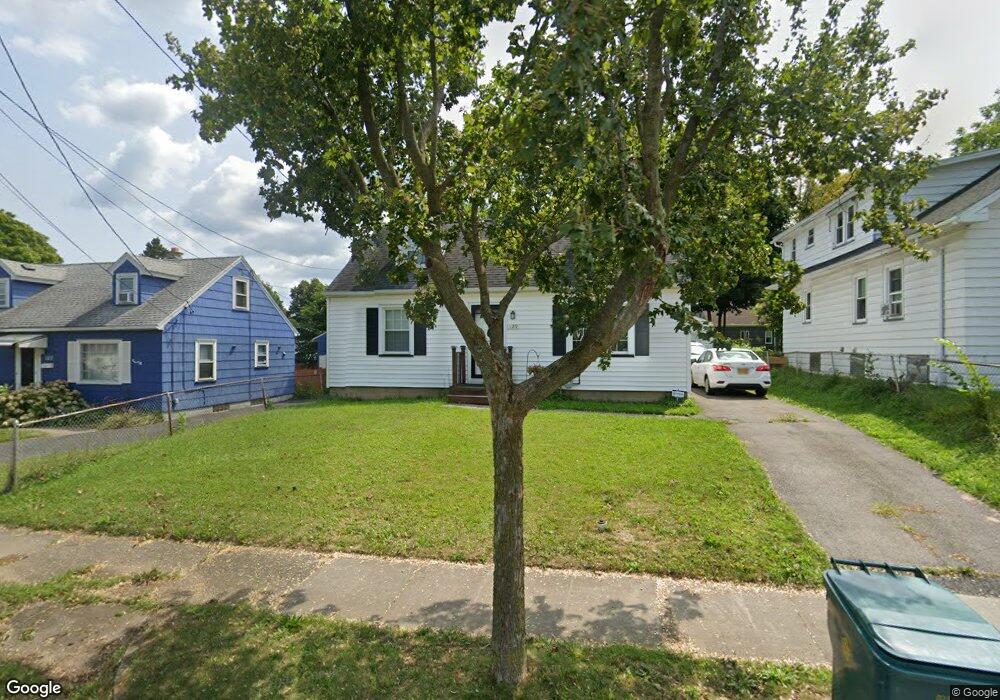
129 Gray St Rochester, NY 14609
Northland-Lyceum NeighborhoodEstimated Value: $162,000 - $190,000
4
Beds
1
Bath
1,239
Sq Ft
$145/Sq Ft
Est. Value
About This Home
This home is located at 129 Gray St, Rochester, NY 14609 and is currently estimated at $179,523, approximately $144 per square foot. 129 Gray St is a home located in Monroe County with nearby schools including School 39-Andrew J. Townson, Mary McLeod Bethune School No. 45, and John James Audubon School No. 33.
Ownership History
Date
Name
Owned For
Owner Type
Purchase Details
Closed on
Jan 12, 2007
Sold by
Rochester Hsg Dev Fund Co
Bought by
Lopez Mayra
Current Estimated Value
Home Financials for this Owner
Home Financials are based on the most recent Mortgage that was taken out on this home.
Original Mortgage
$3,718
Outstanding Balance
$2,214
Interest Rate
6.15%
Mortgage Type
Unknown
Estimated Equity
$177,309
Purchase Details
Closed on
Feb 8, 2006
Sold by
Hud
Bought by
City Of Rochester
Purchase Details
Closed on
Oct 5, 2005
Sold by
Chase Home Finance Llc
Bought by
Secretary Hud
Purchase Details
Closed on
Sep 27, 2005
Sold by
Hall Marion V
Bought by
Chase Home Finance Llc
Purchase Details
Closed on
Jul 1, 1997
Sold by
Trybulski Joanne M
Bought by
Hall Marion and Hall Charlene
Create a Home Valuation Report for This Property
The Home Valuation Report is an in-depth analysis detailing your home's value as well as a comparison with similar homes in the area
Home Values in the Area
Average Home Value in this Area
Purchase History
| Date | Buyer | Sale Price | Title Company |
|---|---|---|---|
| Lopez Mayra | $63,900 | -- | |
| City Of Rochester | $20,000 | -- | |
| Secretary Hud | $70,515 | -- | |
| Chase Home Finance Llc | $70,515 | -- | |
| Hall Marion | $61,000 | -- |
Source: Public Records
Mortgage History
| Date | Status | Borrower | Loan Amount |
|---|---|---|---|
| Open | Lopez Mayra | $3,718 | |
| Open | Lopez Mayra | $61,983 |
Source: Public Records
Tax History Compared to Growth
Tax History
| Year | Tax Paid | Tax Assessment Tax Assessment Total Assessment is a certain percentage of the fair market value that is determined by local assessors to be the total taxable value of land and additions on the property. | Land | Improvement |
|---|---|---|---|---|
| 2024 | $1,350 | $144,200 | $11,500 | $132,700 |
| 2023 | $983 | $82,000 | $6,000 | $76,000 |
| 2022 | $963 | $82,000 | $6,000 | $76,000 |
| 2021 | $978 | $82,000 | $6,000 | $76,000 |
| 2020 | $952 | $82,000 | $6,000 | $76,000 |
| 2019 | $955 | $69,000 | $6,000 | $63,000 |
| 2018 | $1,618 | $69,000 | $6,000 | $63,000 |
| 2017 | $0 | $69,000 | $6,000 | $63,000 |
| 2016 | $955 | $69,000 | $6,000 | $63,000 |
| 2015 | $1,643 | $69,000 | $6,000 | $63,000 |
| 2014 | $1,643 | $69,000 | $6,000 | $63,000 |
Source: Public Records
Map
Nearby Homes