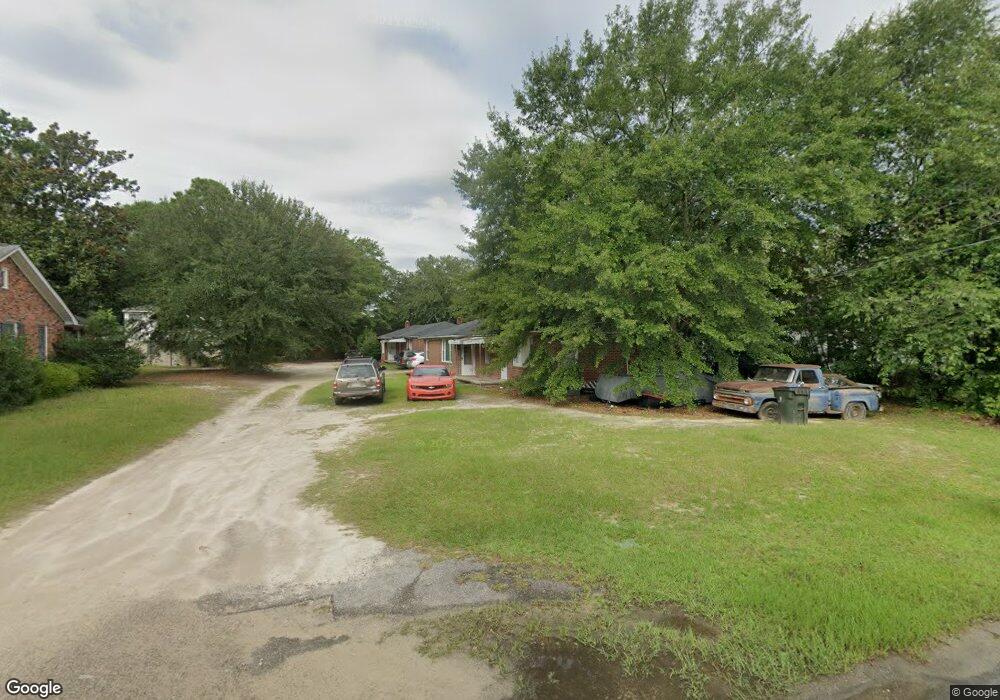
129 Hendrix St Unit 1 West Columbia, SC 29169
Estimated Value: $202,000 - $336,000
2
Beds
1
Bath
600
Sq Ft
$434/Sq Ft
Est. Value
About This Home
This home is located at 129 Hendrix St Unit 1, West Columbia, SC 29169 and is currently estimated at $260,387, approximately $433 per square foot. 129 Hendrix St Unit 1 is a home located in Lexington County with nearby schools including Riverbank Elementary, Northside Middle, and Brookland-Cayce High School.
Ownership History
Date
Name
Owned For
Owner Type
Purchase Details
Closed on
Sep 19, 2019
Sold by
Hendrix Street Llc
Bought by
Fisher Bryce J
Current Estimated Value
Home Financials for this Owner
Home Financials are based on the most recent Mortgage that was taken out on this home.
Original Mortgage
$219,451
Outstanding Balance
$192,222
Interest Rate
3.6%
Mortgage Type
FHA
Estimated Equity
$68,165
Purchase Details
Closed on
Jul 10, 2015
Sold by
Hallman Street Llc
Bought by
Hendrix Street Llc
Purchase Details
Closed on
Feb 3, 2014
Sold by
Moore Charles P
Bought by
Hallman Street Llc
Purchase Details
Closed on
Feb 16, 2007
Sold by
Lovelace Barbara Moore
Bought by
Moore Charles P
Purchase Details
Closed on
Jan 25, 2007
Sold by
Moore Charles Oliver
Bought by
Moore Charles P
Purchase Details
Closed on
Jan 23, 2007
Sold by
Moore Charles O
Bought by
Moore Charles P and Moore Charles Oliver
Create a Home Valuation Report for This Property
The Home Valuation Report is an in-depth analysis detailing your home's value as well as a comparison with similar homes in the area
Home Values in the Area
Average Home Value in this Area
Purchase History
| Date | Buyer | Sale Price | Title Company |
|---|---|---|---|
| Fisher Bryce J | $223,500 | None Available | |
| Hendrix Street Llc | -- | -- | |
| Hallman Street Llc | -- | -- | |
| Moore Charles P | -- | None Available | |
| Moore Charles P | -- | None Available | |
| Moore Charles P | -- | None Available |
Source: Public Records
Mortgage History
| Date | Status | Borrower | Loan Amount |
|---|---|---|---|
| Open | Fisher Bryce J | $219,451 |
Source: Public Records
Tax History Compared to Growth
Tax History
| Year | Tax Paid | Tax Assessment Tax Assessment Total Assessment is a certain percentage of the fair market value that is determined by local assessors to be the total taxable value of land and additions on the property. | Land | Improvement |
|---|---|---|---|---|
| 2024 | $3,489 | $11,160 | $2,000 | $9,160 |
| 2023 | $3,489 | $11,160 | $2,000 | $9,160 |
| 2022 | $3,358 | $11,160 | $2,000 | $9,160 |
| 2020 | $3,195 | $11,160 | $2,000 | $9,160 |
| 2019 | $2,521 | $7,000 | $1,500 | $5,500 |
| 2018 | $2,983 | $8,400 | $1,800 | $6,600 |
| 2017 | $2,928 | $8,400 | $1,800 | $6,600 |
| 2016 | $2,962 | $8,400 | $1,800 | $6,600 |
| 2014 | $2,647 | $8,642 | $1,380 | $7,262 |
| 2013 | -- | $8,640 | $1,380 | $7,260 |
Source: Public Records
Map
Nearby Homes
- 2004 Dew Ave
- 207 Woodhaven Dr
- 215 Sandel Ln
- 415 Graham St
- 165 Cavendish Dr
- 212 Alexandria St
- 116 Silver Run Place
- 0 Platt Springs Rd Unit 606355
- 135 Silver Run Place
- 106 Earl Ct
- 1734 C Ave
- 339 Gum Swamp Trail
- 623 Hook Ave
- 1802 D Ave
- 1615 Holland St
- 349 Gum Swamp Trail
- 309 Hammond Ave
- 617 Holland Cir
- 224 17th St
- 1628 C Ave