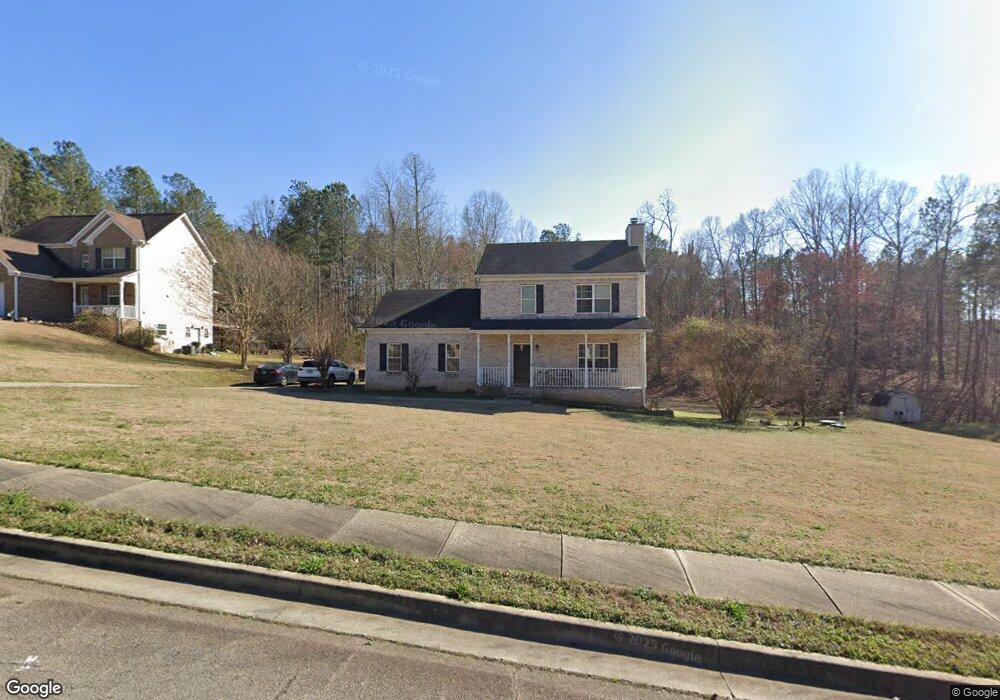
129 Jaley Pkwy Locust Grove, GA 30248
Estimated Value: $274,000 - $298,000
3
Beds
3
Baths
1,697
Sq Ft
$169/Sq Ft
Est. Value
About This Home
This home is located at 129 Jaley Pkwy, Locust Grove, GA 30248 and is currently estimated at $286,517, approximately $168 per square foot. 129 Jaley Pkwy is a home located in Henry County with nearby schools including Locust Grove Elementary School, Locust Grove Middle School, and Locust Grove High School.
Ownership History
Date
Name
Owned For
Owner Type
Purchase Details
Closed on
Apr 14, 2016
Sold by
Brown Todd
Bought by
Haraway Blake
Current Estimated Value
Home Financials for this Owner
Home Financials are based on the most recent Mortgage that was taken out on this home.
Original Mortgage
$140,874
Outstanding Balance
$112,099
Interest Rate
3.73%
Mortgage Type
New Conventional
Estimated Equity
$174,418
Purchase Details
Closed on
Feb 23, 2007
Sold by
Ker-Wil Ents Inc
Bought by
Cuneio Kanella N and Brown Todd
Home Financials for this Owner
Home Financials are based on the most recent Mortgage that was taken out on this home.
Original Mortgage
$132,965
Interest Rate
6.16%
Mortgage Type
FHA
Purchase Details
Closed on
May 22, 2006
Sold by
Rite Way Developers Inc
Bought by
Ker-Will Ents Inc
Home Financials for this Owner
Home Financials are based on the most recent Mortgage that was taken out on this home.
Original Mortgage
$112,425
Interest Rate
6.44%
Create a Home Valuation Report for This Property
The Home Valuation Report is an in-depth analysis detailing your home's value as well as a comparison with similar homes in the area
Home Values in the Area
Average Home Value in this Area
Purchase History
| Date | Buyer | Sale Price | Title Company |
|---|---|---|---|
| Haraway Blake | $137,000 | -- | |
| Cuneio Kanella N | $140,000 | -- | |
| Ker-Will Ents Inc | $38,500 | -- |
Source: Public Records
Mortgage History
| Date | Status | Borrower | Loan Amount |
|---|---|---|---|
| Open | Haraway Blake | $140,874 | |
| Previous Owner | Cuneio Kanella N | $132,965 | |
| Previous Owner | Ker-Will Ents Inc | $112,425 |
Source: Public Records
Tax History Compared to Growth
Tax History
| Year | Tax Paid | Tax Assessment Tax Assessment Total Assessment is a certain percentage of the fair market value that is determined by local assessors to be the total taxable value of land and additions on the property. | Land | Improvement |
|---|---|---|---|---|
| 2025 | $3,091 | $110,360 | $14,000 | $96,360 |
| 2024 | $3,091 | $107,000 | $14,000 | $93,000 |
| 2023 | $2,668 | $109,920 | $14,000 | $95,920 |
| 2022 | $2,639 | $87,320 | $14,000 | $73,320 |
| 2021 | $2,199 | $68,720 | $14,000 | $54,720 |
| 2020 | $2,052 | $62,480 | $11,200 | $51,280 |
| 2019 | $1,938 | $57,680 | $11,200 | $46,480 |
| 2018 | $2,054 | $51,080 | $10,000 | $41,080 |
| 2016 | $2,069 | $51,480 | $10,000 | $41,480 |
| 2015 | $1,350 | $39,040 | $7,200 | $31,840 |
| 2014 | $1,240 | $36,000 | $8,000 | $28,000 |
Source: Public Records
Map
Nearby Homes
- 121 Jaley Pkwy
- 703 Grove Pointe Cir
- 620 Grove Pointe Way
- 533 Grove Pointe Ct Unit 1
- 380 Higgins Rd
- 425 Bell Flower Trail
- 213 Umber Rd
- 212 Umber Rd
- 501 Kirkland Dr
- 505 Kirkland Dr
- 208 Umber Rd
- 194 Aster Ave
- 198 Aster Ave
- 190 Aster Ave
- 186 Aster Ave
- 182 Aster Ave
- 9036 Holder Rd
- 191 Aster Ave
- 178 Aster Ave
- 501 Vervain Dr
- 133 Jaley Pkwy
- 0 Jaley Pkwy Unit 7324625
- 0 Jaley Pkwy Unit 7350516
- 0 Jaley Pkwy Unit 7241149
- 0 Jaley Pkwy Unit 7330842
- 0 Jaley Pkwy Unit 7275649
- 0 Jaley Pkwy Unit 7195943
- 0 Jaley Pkwy Unit 3276821
- 0 Jaley Pkwy Unit 8394929
- 0 Jaley Pkwy Unit 7588229
- 0 Jaley Pkwy Unit 7521222
- 0 Jaley Pkwy Unit 7245099
- 0 Jaley Pkwy Unit 7129523
- 0 Jaley Pkwy Unit 7293511
- 0 Jaley Pkwy
- 203 Abby Ct
- 128 Jaley Pkwy
- 0 Abby Ct Unit 7363419
- 0 Abby Ct
- 117 Jaley Pkwy