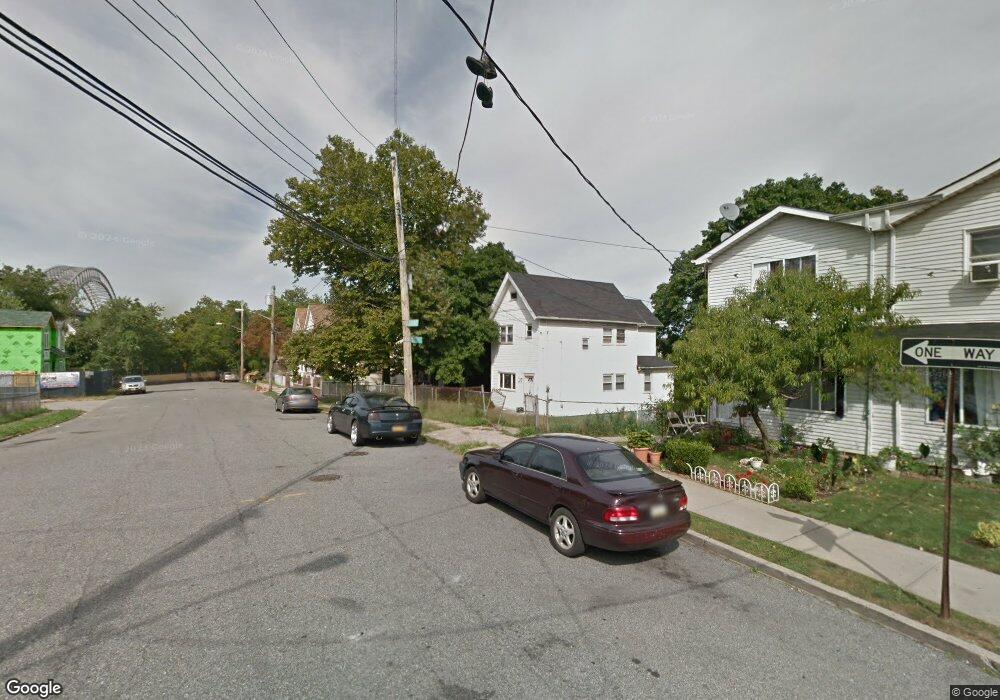
129 John St Staten Island, NY 10302
Port Richmond NeighborhoodEstimated Value: $626,000 - $716,000
--
Bed
--
Bath
2,110
Sq Ft
$312/Sq Ft
Est. Value
About This Home
This home is located at 129 John St, Staten Island, NY 10302 and is currently estimated at $658,323, approximately $312 per square foot. 129 John St is a home located in Richmond County with nearby schools including PS 21 Margaret Emery-Elm Park, I.S. 51 Edwin Markham, and Port Richmond High School.
Ownership History
Date
Name
Owned For
Owner Type
Purchase Details
Closed on
Jan 22, 2025
Sold by
Orea Juan Angel
Bought by
Orea Irrevocable Trust and Orea
Current Estimated Value
Purchase Details
Closed on
Mar 11, 2022
Sold by
Czajkowski David W
Bought by
Orea Juan Angel and Orea Jonathan
Home Financials for this Owner
Home Financials are based on the most recent Mortgage that was taken out on this home.
Original Mortgage
$424,000
Interest Rate
3.85%
Mortgage Type
New Conventional
Purchase Details
Closed on
Feb 21, 2007
Sold by
Czajkowski Dorothy Mazur
Bought by
Czajkowski David W and Czajkowski Steven J
Purchase Details
Closed on
Nov 16, 1998
Sold by
Czajkowski Dorothy Mazur
Bought by
Mazur Czajkowski Stanley and Mazur Czajkowski Dorothy
Purchase Details
Closed on
Jul 19, 1996
Sold by
Mazur Adam A
Bought by
Czajkowski Dorothy Mazur
Create a Home Valuation Report for This Property
The Home Valuation Report is an in-depth analysis detailing your home's value as well as a comparison with similar homes in the area
Home Values in the Area
Average Home Value in this Area
Purchase History
| Date | Buyer | Sale Price | Title Company |
|---|---|---|---|
| Orea Irrevocable Trust | -- | Jewett Abstract | |
| Orea Juan Angel | -- | Jewett Abstract | |
| Orea Juan Angel | $530,000 | None Listed On Document | |
| Czajkowski David W | -- | None Available | |
| Mazur Czajkowski Stanley | -- | First American Title Ins Co | |
| Czajkowski Dorothy Mazur | -- | First American Title Ins Co |
Source: Public Records
Mortgage History
| Date | Status | Borrower | Loan Amount |
|---|---|---|---|
| Previous Owner | Orea Juan Angel | $424,000 |
Source: Public Records
Tax History Compared to Growth
Tax History
| Year | Tax Paid | Tax Assessment Tax Assessment Total Assessment is a certain percentage of the fair market value that is determined by local assessors to be the total taxable value of land and additions on the property. | Land | Improvement |
|---|---|---|---|---|
| 2025 | $4,484 | $40,560 | $6,022 | $34,538 |
| 2024 | $4,484 | $33,120 | $6,957 | $26,163 |
| 2023 | $4,278 | $21,064 | $5,844 | $15,220 |
| 2022 | $3,967 | $30,240 | $10,320 | $19,920 |
| 2021 | $875 | $29,400 | $10,320 | $19,080 |
| 2020 | $920 | $27,900 | $10,320 | $17,580 |
| 2019 | $801 | $26,160 | $10,320 | $15,840 |
| 2018 | $683 | $17,553 | $7,987 | $9,566 |
| 2017 | $2,377 | $16,560 | $10,320 | $6,240 |
| 2016 | $2,811 | $19,200 | $10,320 | $8,880 |
| 2015 | $2,365 | $18,316 | $8,236 | $10,080 |
| 2014 | $2,365 | $17,280 | $8,580 | $8,700 |
Source: Public Records
Map
Nearby Homes
- 162 John St
- 98 Saint Josephs Ave
- 209 Nicholas Ave
- 145 Morningside Ave Unit 2C
- 28 Morningstar Rd
- 54 Riverside Dr Unit 1AA
- 231 Charles Ave
- 145 Clinton Place
- 211 Morningstar Rd
- 121 Harrison Ave
- 27 Wright Ave
- 38 Laforge Ave
- 1594 Castleton Ave
- 11 Laforge Ave
- 152 Port Richmond Ave
- 28 Hooker Place
- 306 Morningstar Rd
- 469 Port Richmond Ave
- 322 Morningstar Rd
- 21 Simonson Ave