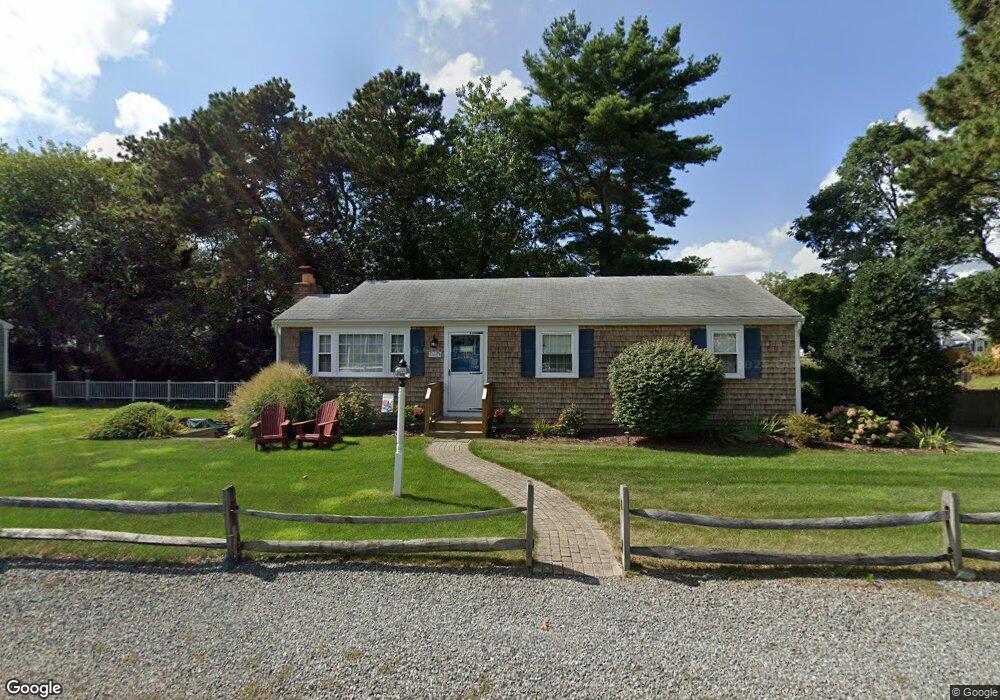
129 Kibby Ln Dennis Port, MA 02639
Dennis Port NeighborhoodEstimated Value: $582,000 - $641,000
3
Beds
1
Bath
1,016
Sq Ft
$599/Sq Ft
Est. Value
About This Home
This home is located at 129 Kibby Ln, Dennis Port, MA 02639 and is currently estimated at $609,020, approximately $599 per square foot. 129 Kibby Ln is a home located in Barnstable County with nearby schools including Dennis-Yarmouth Regional High School and St. Pius X. School.
Ownership History
Date
Name
Owned For
Owner Type
Purchase Details
Closed on
Jun 20, 1997
Sold by
Duffy Patricia A and Harrington Nancy D
Bought by
Minnick Donna M and Minnick Ronald A
Current Estimated Value
Home Financials for this Owner
Home Financials are based on the most recent Mortgage that was taken out on this home.
Original Mortgage
$65,000
Interest Rate
7.87%
Mortgage Type
Purchase Money Mortgage
Create a Home Valuation Report for This Property
The Home Valuation Report is an in-depth analysis detailing your home's value as well as a comparison with similar homes in the area
Home Values in the Area
Average Home Value in this Area
Purchase History
| Date | Buyer | Sale Price | Title Company |
|---|---|---|---|
| Ronald & Donna Minnick Lt | -- | -- | |
| Minnick Donna M | $98,000 | -- | |
| Minnick Donna M | $98,000 | -- |
Source: Public Records
Mortgage History
| Date | Status | Borrower | Loan Amount |
|---|---|---|---|
| Previous Owner | Minnick Donna M | $65,000 |
Source: Public Records
Tax History Compared to Growth
Tax History
| Year | Tax Paid | Tax Assessment Tax Assessment Total Assessment is a certain percentage of the fair market value that is determined by local assessors to be the total taxable value of land and additions on the property. | Land | Improvement |
|---|---|---|---|---|
| 2025 | $2,304 | $532,000 | $193,500 | $338,500 |
| 2024 | $2,167 | $493,600 | $186,100 | $307,500 |
| 2023 | $2,096 | $448,800 | $169,200 | $279,600 |
| 2022 | $1,990 | $355,400 | $152,400 | $203,000 |
| 2021 | $2,041 | $338,500 | $170,800 | $167,700 |
| 2020 | $1,839 | $301,400 | $149,400 | $152,000 |
| 2019 | $1,737 | $281,600 | $146,500 | $135,100 |
| 2018 | $1,652 | $260,600 | $139,500 | $121,100 |
| 2017 | $1,517 | $246,700 | $129,500 | $117,200 |
| 2016 | $1,541 | $236,000 | $139,500 | $96,500 |
| 2015 | $1,510 | $236,000 | $139,500 | $96,500 |
| 2014 | $1,372 | $216,000 | $119,500 | $96,500 |
Source: Public Records
Map
Nearby Homes
- 12 The Other Rd
- 102 Cornell Dr
- 4 Coffey Ln
- 22 Wixon Rd
- 125 Main St Unit 3
- 71 Main St
- 72 Bassett Ln
- 301 Main St
- 268 Main St
- 62 Teal Cir
- 15 Glendon Rd
- 855 Main St
- 5 Polly Fisk Ln Unit 5
- 51 Princeton Cir
- 21 Bayberry Ln
- 15 Woodside Park Rd
- 19 Ocean Dr Unit 2
- 435 Main St Unit 1
- 7 Ferncliff Rd
- 26 Center St
- 25 Standish Way
- 146 Cornell Dr
- 123 Kibby Ln
- 128 Kibby Ln
- 124 Kibby Ln
- 82 Lower County Rd Unit 5
- 82 Lower County Rd Unit 23
- 82 Lower County Rd Unit 2
- 134 Cornell Dr
- 18 Standish Way
- 118 Kibby Ln
- 23 Standish Way
- 134 Kibby Ln
- 119 Kibby Ln
- 26 Puritan Ln
- 19 Standish Way
- 132 Cornell Dr
- 143 Cornell Dr
- 17 Cynthia Ln
- 139 Cornell Dr