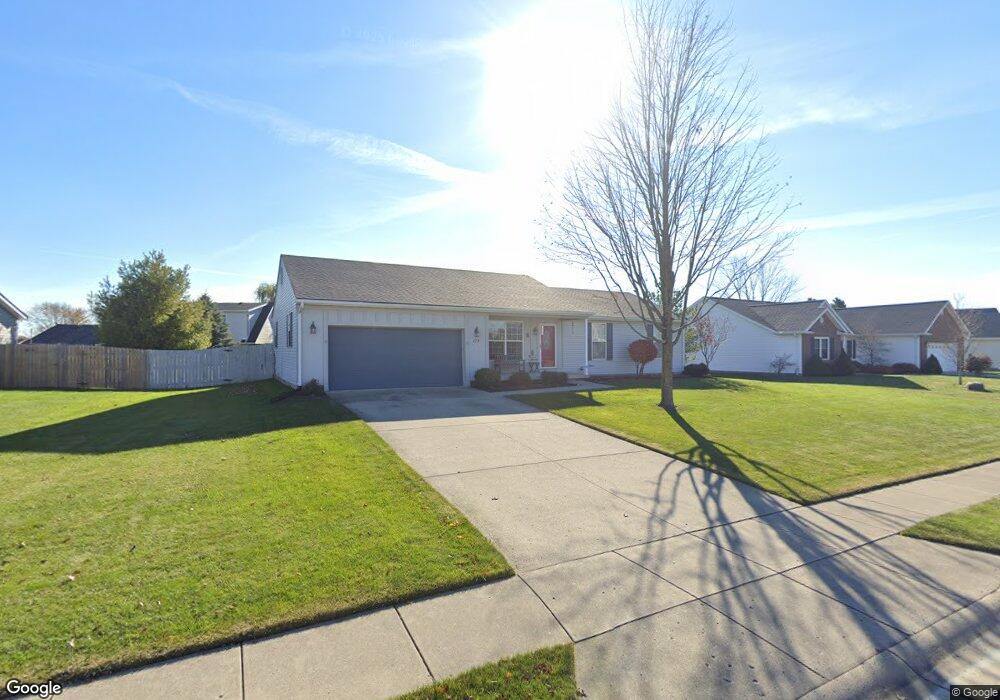
129 Long Bay Urbana, OH 43078
Estimated Value: $252,000 - $304,000
3
Beds
2
Baths
1,396
Sq Ft
$193/Sq Ft
Est. Value
About This Home
This home is located at 129 Long Bay, Urbana, OH 43078 and is currently estimated at $269,362, approximately $192 per square foot. 129 Long Bay is a home located in Champaign County with nearby schools including Urbana Elementary School, Urbana High School, and Urbana Community School.
Ownership History
Date
Name
Owned For
Owner Type
Purchase Details
Closed on
Jun 24, 2005
Sold by
Mclaughlin Gregory S
Bought by
Kline Sharon
Current Estimated Value
Home Financials for this Owner
Home Financials are based on the most recent Mortgage that was taken out on this home.
Original Mortgage
$107,900
Outstanding Balance
$63,062
Interest Rate
7.67%
Mortgage Type
Fannie Mae Freddie Mac
Estimated Equity
$206,300
Purchase Details
Closed on
Feb 2, 2004
Sold by
Midwest Golf Group Inc
Bought by
Mclaughlin Gregory S
Create a Home Valuation Report for This Property
The Home Valuation Report is an in-depth analysis detailing your home's value as well as a comparison with similar homes in the area
Home Values in the Area
Average Home Value in this Area
Purchase History
| Date | Buyer | Sale Price | Title Company |
|---|---|---|---|
| Kline Sharon | $134,900 | Partners Land Title Agency | |
| Mclaughlin Gregory S | $24,000 | -- |
Source: Public Records
Mortgage History
| Date | Status | Borrower | Loan Amount |
|---|---|---|---|
| Open | Kline Sharon | $107,900 |
Source: Public Records
Tax History Compared to Growth
Tax History
| Year | Tax Paid | Tax Assessment Tax Assessment Total Assessment is a certain percentage of the fair market value that is determined by local assessors to be the total taxable value of land and additions on the property. | Land | Improvement |
|---|---|---|---|---|
| 2024 | $2,511 | $61,060 | $10,040 | $51,020 |
| 2023 | $2,511 | $61,060 | $10,040 | $51,020 |
| 2022 | $2,562 | $61,060 | $10,040 | $51,020 |
| 2021 | $2,400 | $50,700 | $8,030 | $42,670 |
| 2020 | $2,400 | $50,700 | $8,030 | $42,670 |
| 2019 | $2,371 | $50,700 | $8,030 | $42,670 |
| 2018 | $2,366 | $48,360 | $6,860 | $41,500 |
| 2017 | $2,349 | $48,360 | $6,860 | $41,500 |
| 2016 | $2,354 | $48,360 | $6,860 | $41,500 |
| 2015 | $2,327 | $46,380 | $6,860 | $39,520 |
| 2014 | $2,329 | $46,380 | $6,860 | $39,520 |
| 2013 | $1,982 | $46,380 | $6,860 | $39,520 |
Source: Public Records
Map
Nearby Homes