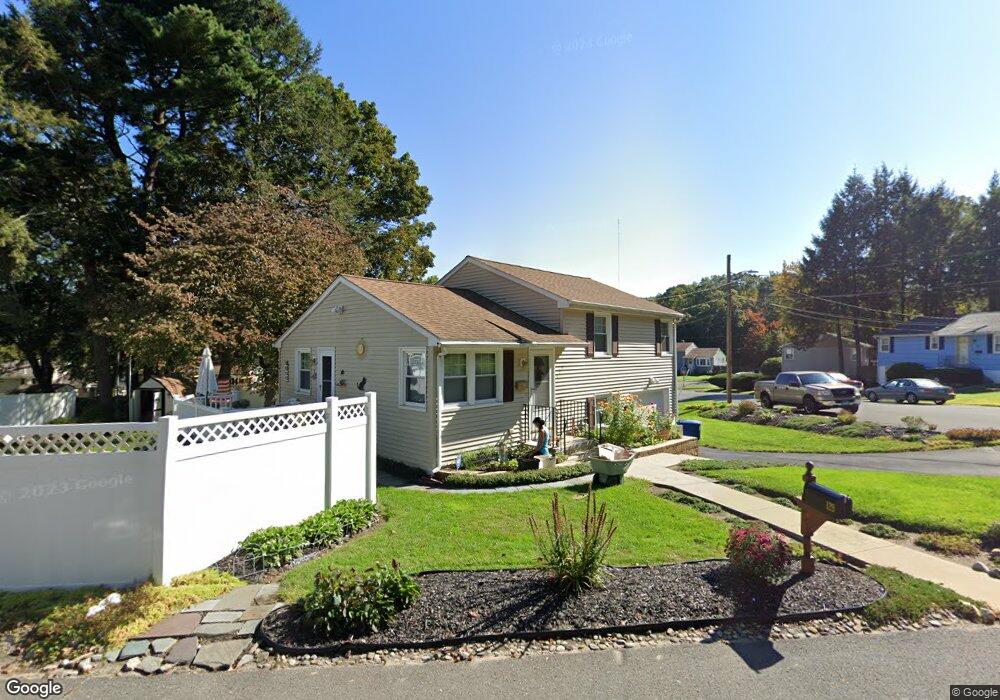
129 Longmeadow Dr Waterbury, CT 06706
South End District NeighborhoodEstimated Value: $196,000 - $253,472
3
Beds
1
Bath
864
Sq Ft
$259/Sq Ft
Est. Value
About This Home
This home is located at 129 Longmeadow Dr, Waterbury, CT 06706 and is currently estimated at $223,368, approximately $258 per square foot. 129 Longmeadow Dr is a home located in New Haven County with nearby schools including John G. Gilmartin Elementary School, John F. Kennedy High School, and Our Lady Of Mount Carmel School.
Ownership History
Date
Name
Owned For
Owner Type
Purchase Details
Closed on
Mar 23, 2010
Sold by
Fnma
Bought by
Ritucci Rita Jo
Current Estimated Value
Home Financials for this Owner
Home Financials are based on the most recent Mortgage that was taken out on this home.
Original Mortgage
$34,272
Outstanding Balance
$22,794
Interest Rate
5.05%
Mortgage Type
Purchase Money Mortgage
Estimated Equity
$200,574
Purchase Details
Closed on
Nov 13, 2009
Sold by
One West Bk
Bought by
Federal National Mortgage Association
Purchase Details
Closed on
Oct 27, 2009
Sold by
Rodriguez Joseph and Rodriguez Zoraida
Bought by
One West Bk
Purchase Details
Closed on
Oct 20, 2005
Sold by
France Timothy J and Flammia Gina
Bought by
Rodriguez Joseph and Rdoriguez Zoraida
Purchase Details
Closed on
Jul 16, 1999
Sold by
Duffield Jeffrey A and Duffield Lorna J
Bought by
France Timothy J
Create a Home Valuation Report for This Property
The Home Valuation Report is an in-depth analysis detailing your home's value as well as a comparison with similar homes in the area
Home Values in the Area
Average Home Value in this Area
Purchase History
| Date | Buyer | Sale Price | Title Company |
|---|---|---|---|
| Ritucci Rita Jo | $87,120 | -- | |
| Federal National Mortgage Association | -- | -- | |
| One West Bk | -- | -- | |
| Rodriguez Joseph | $141,000 | -- | |
| France Timothy J | $78,000 | -- |
Source: Public Records
Mortgage History
| Date | Status | Borrower | Loan Amount |
|---|---|---|---|
| Open | France Timothy J | $34,272 | |
| Open | France Timothy J | $95,728 | |
| Previous Owner | France Timothy J | $151,840 |
Source: Public Records
Tax History Compared to Growth
Tax History
| Year | Tax Paid | Tax Assessment Tax Assessment Total Assessment is a certain percentage of the fair market value that is determined by local assessors to be the total taxable value of land and additions on the property. | Land | Improvement |
|---|---|---|---|---|
| 2025 | $4,326 | $96,180 | $17,290 | $78,890 |
| 2024 | $4,755 | $96,180 | $17,290 | $78,890 |
| 2023 | $5,212 | $96,180 | $17,290 | $78,890 |
| 2022 | $3,841 | $63,790 | $17,290 | $46,500 |
| 2021 | $3,841 | $63,790 | $17,290 | $46,500 |
| 2020 | $3,841 | $63,790 | $17,290 | $46,500 |
| 2019 | $3,841 | $63,790 | $17,290 | $46,500 |
| 2018 | $3,841 | $63,790 | $17,290 | $46,500 |
| 2017 | $3,959 | $65,760 | $17,290 | $48,470 |
| 2016 | $3,959 | $65,760 | $17,290 | $48,470 |
| 2015 | $3,829 | $65,760 | $17,290 | $48,470 |
| 2014 | $3,829 | $65,760 | $17,290 | $48,470 |
Source: Public Records
Map
Nearby Homes
- 212 Pearl Lake Rd
- 73 Cornelius Ave
- 171 Kelsey St
- 35 Pearl Lake Rd Unit B
- 236 Union City Rd
- 463 Pearl Lake Rd
- 29 Ramsey Ave
- 562 Piedmont St
- 00 Milton Ave
- 16 Highview St
- 335 Raymond St
- 35 Monahan Ln
- 185 Eastside Blvd
- 1385 Highland Ave Unit 20A
- 92 Welland Ave
- 1159 Highland Ave Unit 35A
- 1159 Highland Ave Unit 28B
- 439 Piedmont St
- 34 Katie Ln
- 207 Nichols Dr
- 11 Eugene Dr
- 134 Longmeadow Dr
- 10 Eugene Dr
- 128 Longmeadow Dr
- 141 Longmeadow Dr
- 121 Longmeadow Dr
- 140 Longmeadow Dr
- 122 Longmeadow Dr
- 114 Shadee Ln
- 126 Shadee Ln
- 115 Longmeadow Dr
- 104 Shadee Ln
- 116 Longmeadow Dr
- 115 Eugene Dr
- 125 Eugene Dr
- 20 Alpine Ave
- 98 Shadee Ln
- 109 Longmeadow Dr
- 103 Shadee Ln
- 108 Longmeadow Dr