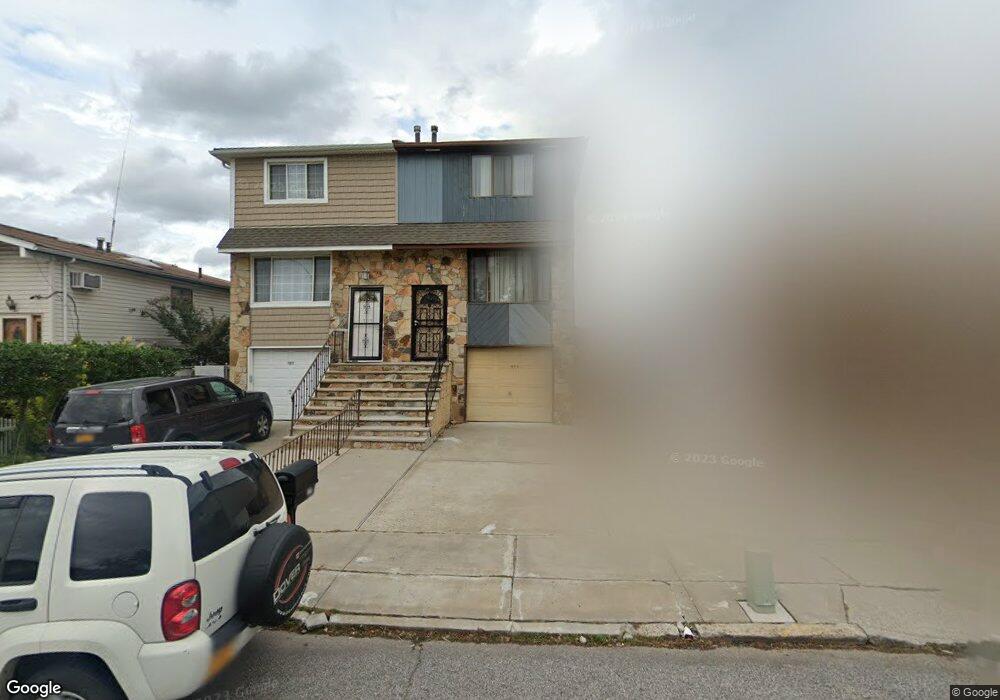
129 Ludwig Ln Staten Island, NY 10303
Graniteville NeighborhoodEstimated Value: $548,707 - $675,000
--
Bed
4
Baths
1,376
Sq Ft
$429/Sq Ft
Est. Value
About This Home
This home is located at 129 Ludwig Ln, Staten Island, NY 10303 and is currently estimated at $590,927, approximately $429 per square foot. 129 Ludwig Ln is a home located in Richmond County with nearby schools including P.S. 22 Graniteville, I.S. 51 Edwin Markham, and Port Richmond High School.
Ownership History
Date
Name
Owned For
Owner Type
Purchase Details
Closed on
Oct 19, 1995
Sold by
Ozinegbe Folashade D
Bought by
Ozinegbe Folashade O and Ozinegbe Timothy
Current Estimated Value
Purchase Details
Closed on
Mar 24, 1995
Sold by
Garriss Ursula
Bought by
Ozinegbe Folashade
Home Financials for this Owner
Home Financials are based on the most recent Mortgage that was taken out on this home.
Original Mortgage
$137,750
Interest Rate
8.2%
Create a Home Valuation Report for This Property
The Home Valuation Report is an in-depth analysis detailing your home's value as well as a comparison with similar homes in the area
Home Values in the Area
Average Home Value in this Area
Purchase History
| Date | Buyer | Sale Price | Title Company |
|---|---|---|---|
| Ozinegbe Folashade O | -- | -- | |
| Ozinegbe Folashade | $145,000 | First American Title Ins Co |
Source: Public Records
Mortgage History
| Date | Status | Borrower | Loan Amount |
|---|---|---|---|
| Previous Owner | Ozinegbe Folashade | $137,750 |
Source: Public Records
Tax History Compared to Growth
Tax History
| Year | Tax Paid | Tax Assessment Tax Assessment Total Assessment is a certain percentage of the fair market value that is determined by local assessors to be the total taxable value of land and additions on the property. | Land | Improvement |
|---|---|---|---|---|
| 2025 | $4,777 | $36,660 | $5,505 | $31,155 |
| 2024 | $4,789 | $35,040 | $5,434 | $29,606 |
| 2023 | $4,541 | $23,760 | $5,554 | $18,206 |
| 2022 | $4,456 | $28,740 | $7,560 | $21,180 |
| 2021 | $4,660 | $30,300 | $7,560 | $22,740 |
| 2020 | $4,413 | $28,980 | $7,560 | $21,420 |
| 2019 | $4,098 | $25,980 | $7,560 | $18,420 |
| 2018 | $3,739 | $19,800 | $7,560 | $12,240 |
| 2017 | $4,084 | $21,505 | $7,403 | $14,102 |
| 2016 | $3,746 | $20,288 | $7,474 | $12,814 |
| 2015 | $3,368 | $19,140 | $6,300 | $12,840 |
| 2014 | $3,368 | $19,140 | $6,300 | $12,840 |
Source: Public Records
Map
Nearby Homes
- 151 Amity Place
- 123 Amity Place
- 32 Amador St
- 54 Selvin Loop Unit A
- 58 Selvin Loop Unit 153
- 49 Doreen Dr
- 21 Carol Place
- 414 Wilcox St
- 37 Ludwig Ln
- 81 Selvin Loop Unit A
- 81 Selvin Loop
- 33 Ludwig Ln
- 268 Ada Dr
- 12 Doreen Dr
- 38 Eleanor Place
- 51 Adrianne Ln
- 15 Ludwig Ln
- 5 Ludwig Ln Unit B
- 268 Bruckner Ave Unit 268
- 151 Regis Dr
- 131 Ludwig Ln
- 125 Ludwig Ln
- 123 Ludwig Ln
- 135 Ludwig Ln
- 121 Ludwig Ln
- 153 Amity Place
- 139 Ludwig Ln
- 119 Ludwig Ln
- 147 Amity Place
- 89 Francesca Ln
- 89 Francesca Ln Unit 1
- 115 Ludwig Ln
- 145 Amity Place
- 87 Francesca Ln
- 141 Amity Place
- 85 Francesca Ln
- 130 Ludwig Ln
- 111 Ludwig Ln
- 111 Ludwig Ln Unit 2
- 126 Ludwig Ln