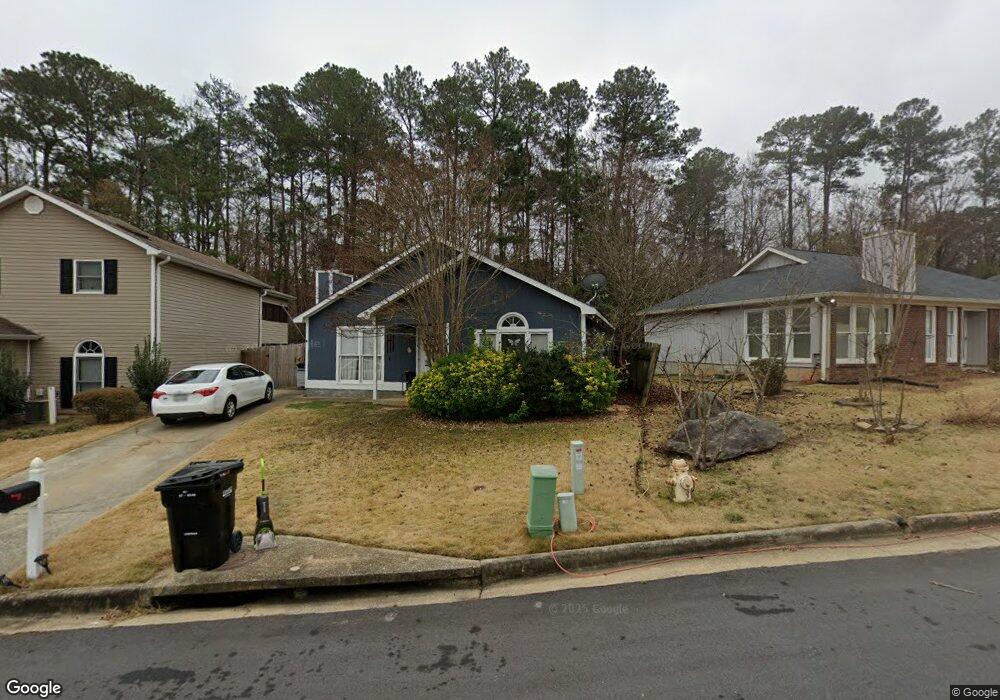
129 Maplebrook Ct Columbus, GA 31904
North Columbus NeighborhoodEstimated Value: $130,000 - $193,000
2
Beds
3
Baths
1,264
Sq Ft
$136/Sq Ft
Est. Value
About This Home
This home is located at 129 Maplebrook Ct, Columbus, GA 31904 and is currently estimated at $171,672, approximately $135 per square foot. 129 Maplebrook Ct is a home located in Muscogee County with nearby schools including Double Churches Elementary School, Veterans Memorial Middle School, and Northside High School.
Ownership History
Date
Name
Owned For
Owner Type
Purchase Details
Closed on
Feb 22, 2018
Sold by
Us Department Of Housing A
Bought by
Greenlite Properties Llc
Current Estimated Value
Purchase Details
Closed on
Aug 11, 2017
Sold by
Carrington Mtg Svcs Llc
Bought by
Secretary Of Housing And Urban
Purchase Details
Closed on
Aug 1, 2017
Sold by
Braddy Benjamin W
Bought by
Carrington Mtg Svcs Llc
Purchase Details
Closed on
Jan 30, 2008
Sold by
Manning James O
Bought by
Braddy Benjamin W and Braddy Breanne L
Home Financials for this Owner
Home Financials are based on the most recent Mortgage that was taken out on this home.
Original Mortgage
$121,001
Interest Rate
6.17%
Mortgage Type
FHA
Create a Home Valuation Report for This Property
The Home Valuation Report is an in-depth analysis detailing your home's value as well as a comparison with similar homes in the area
Home Values in the Area
Average Home Value in this Area
Purchase History
| Date | Buyer | Sale Price | Title Company |
|---|---|---|---|
| Greenlite Properties Llc | $68,000 | -- | |
| Secretary Of Housing And Urban | -- | -- | |
| Carrington Mtg Svcs Llc | $59,290 | -- | |
| Braddy Benjamin W | $122,900 | None Available |
Source: Public Records
Mortgage History
| Date | Status | Borrower | Loan Amount |
|---|---|---|---|
| Previous Owner | Braddy Benjamin W | $121,001 |
Source: Public Records
Tax History
| Year | Tax Paid | Tax Assessment Tax Assessment Total Assessment is a certain percentage of the fair market value that is determined by local assessors to be the total taxable value of land and additions on the property. | Land | Improvement |
|---|---|---|---|---|
| 2025 | $2,187 | $55,876 | $20,264 | $35,612 |
| 2024 | $2,187 | $55,876 | $20,264 | $35,612 |
| 2023 | $2,201 | $55,876 | $20,264 | $35,612 |
| 2022 | $1,721 | $42,140 | $15,200 | $26,940 |
| 2021 | $1,328 | $32,452 | $15,200 | $17,252 |
| 2020 | $1,325 | $32,452 | $15,200 | $17,252 |
| 2019 | $1,114 | $27,200 | $9,800 | $17,400 |
| 2018 | $1,884 | $45,992 | $15,200 | $30,792 |
| 2017 | $1,890 | $45,992 | $15,200 | $30,792 |
| 2016 | $2,028 | $49,158 | $4,704 | $44,454 |
| 2015 | $1,483 | $49,158 | $4,704 | $44,454 |
| 2014 | $1,485 | $49,158 | $4,704 | $44,454 |
| 2013 | -- | $49,158 | $4,704 | $44,454 |
Source: Public Records
Map
Nearby Homes
- 1442 Grove Park Dr Unit 2
- 1442 Grove Park Dr Unit 8
- 7724 Gray Shoals Dr
- 7730 Edgewater Dr
- 7841 Edgewater Dr
- 8334 Canaan Dr
- 1727 Fountain Ct
- 1438 Grove Park Dr Unit 13B
- 1438 Grove Park Dr Unit 11B
- 907 Double Churches Rd
- 1608 Double Churches Rd
- 994 Timber Creek Way
- 7309 Kirkwood Dr
- 1254 Cottage Pointe Ct
- 6742 Bridge Way
- 1355 Cloverdale Rd
- 517 Double Churches Rd
- 1195 Cloverdale Rd
- 1430 Cloverdale Rd
- 6712 Bridge Way
- 125 Maplebrook Ct
- 133 Maplebrook Ct
- 121 Maplebrook Ct
- 137 Maplebrook Ct
- 117 Maplebrook Ct
- 141 Maplebrook Ct
- 120 Maplebrook Ct
- 124 Maplebrook Ct
- 116 Maplebrook Ct
- 113 Maplebrook Ct
- 128 Maplebrook Ct
- 112 Maplebrook Ct
- 108 Maplebrook Ct
- 132 Maplebrook Ct
- 145 Maplebrook Ct
- 136 Maplebrook Ct
- 144 Maplebrook Ct
- 149 Maplebrook Ct
- 1362 Maplebrook Dr
- 1358 Maplebrook Dr
Your Personal Tour Guide
Ask me questions while you tour the home.