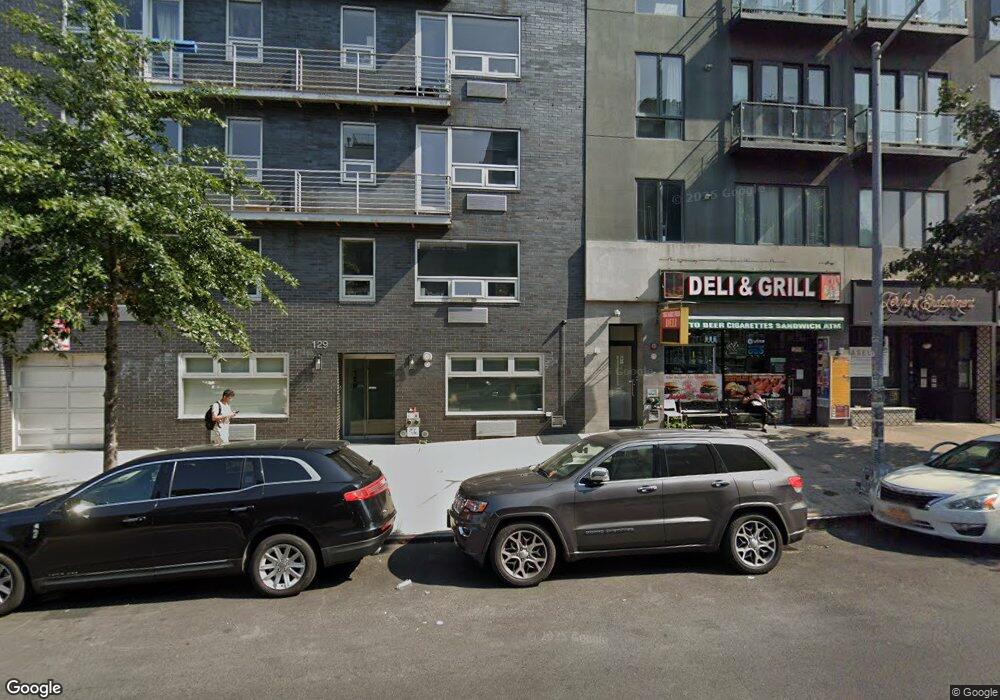
129 Metropolitan Ave Unit 6A Brooklyn, NY 11211
Williamsburg NeighborhoodEstimated Value: $1,666,198 - $2,125,000
3
Beds
2
Baths
1,106
Sq Ft
$1,706/Sq Ft
Est. Value
About This Home
This home is located at 129 Metropolitan Ave Unit 6A, Brooklyn, NY 11211 and is currently estimated at $1,886,550, approximately $1,705 per square foot. 129 Metropolitan Ave Unit 6A is a home located in Kings County with nearby schools including P.S. 17 Henry D Woodworth, Success Academy Williamsburg, and Williamsburg Montessori.
Ownership History
Date
Name
Owned For
Owner Type
Purchase Details
Closed on
Jan 14, 2022
Sold by
Duchemin Gaelle and Uh Steven
Bought by
Davis Meaghan and Larsen Spencer
Current Estimated Value
Home Financials for this Owner
Home Financials are based on the most recent Mortgage that was taken out on this home.
Original Mortgage
$1,400,000
Outstanding Balance
$1,292,121
Interest Rate
3.22%
Mortgage Type
Purchase Money Mortgage
Estimated Equity
$594,429
Purchase Details
Closed on
Dec 18, 2009
Sold by
Metropolitan Plaza Llc
Bought by
Duchemin Gaelle and Uh Steven
Home Financials for this Owner
Home Financials are based on the most recent Mortgage that was taken out on this home.
Original Mortgage
$417,000
Interest Rate
4.85%
Mortgage Type
Purchase Money Mortgage
Create a Home Valuation Report for This Property
The Home Valuation Report is an in-depth analysis detailing your home's value as well as a comparison with similar homes in the area
Home Values in the Area
Average Home Value in this Area
Purchase History
| Date | Buyer | Sale Price | Title Company |
|---|---|---|---|
| Davis Meaghan | $1,750,000 | -- | |
| Duchemin Gaelle | $700,000 | -- | |
| Duchemin Gaelle | $700,000 | -- |
Source: Public Records
Mortgage History
| Date | Status | Borrower | Loan Amount |
|---|---|---|---|
| Open | Davis Meaghan | $1,400,000 | |
| Previous Owner | Duchemin Gaelle | $417,000 |
Source: Public Records
Tax History Compared to Growth
Tax History
| Year | Tax Paid | Tax Assessment Tax Assessment Total Assessment is a certain percentage of the fair market value that is determined by local assessors to be the total taxable value of land and additions on the property. | Land | Improvement |
|---|---|---|---|---|
| 2025 | $13,633 | $125,200 | $4,208 | $120,992 |
| 2024 | $13,633 | $128,017 | $4,208 | $123,809 |
| 2023 | $10,303 | $114,206 | $4,208 | $109,998 |
| 2022 | $7,394 | $104,094 | $4,208 | $99,886 |
| 2021 | $4,758 | $92,233 | $4,208 | $88,025 |
| 2020 | $1,252 | $106,694 | $4,208 | $102,486 |
| 2019 | $398 | $103,770 | $4,208 | $99,562 |
| 2018 | $402 | $86,276 | $4,209 | $82,067 |
| 2017 | $402 | $80,589 | $4,208 | $76,381 |
| 2016 | $407 | $78,314 | $4,208 | $74,106 |
| 2015 | $318 | $70,028 | $4,208 | $65,820 |
| 2014 | $318 | $57,409 | $4,209 | $53,200 |
Source: Public Records
Map
Nearby Homes
- 100 N 3rd St Unit 3 D
- 100 N 3rd St Unit 2B/4P
- 100 N 3rd St Unit 2A
- 219 Berry St Unit 2
- 85 N 3rd St Unit 204
- 96 N 1st St Unit 5
- 96 N 1st St Unit 3
- 96 N 1st St Unit TH 1
- 62 N 3rd St Unit 3-B
- 80 Metropolitan Ave Unit 4E
- 66 N 1st St Unit 4D
- 66 N 1st St Unit 1 C
- 66 N 1st St Unit 4-D
- 66 N 1st St Unit 1 C
- 142 N 1st St Unit 1-A
- 151 Grand St Unit 8
- 151 Grand St Unit 8
- 265 Berry St
- 58 Metropolitan Ave Unit 2B
- 94 S 1st St
- 129 Metropolitan Ave Unit 6B
- 129 Metropolitan Ave Unit 5B
- 129 Metropolitan Ave Unit 5A
- 129 Metropolitan Ave Unit 4B
- 129 Metropolitan Ave Unit 4A
- 129 Metropolitan Ave Unit 3B
- 129 Metropolitan Ave Unit 3A
- 129 Metropolitan Ave Unit 2B
- 129 Metropolitan Ave Unit 2A
- 129 Metropolitan Ave Unit 1B
- 129 Metropolitan Ave Unit 1A
- 129 Metropolitan Ave
- 129 Metropolitan Ave Unit P3
- 129 Metropolitan Ave Unit P5
- 129 Metropolitan Ave Unit P2
- 129 Metropolitan Ave Unit P1
- 129 Metropolitan Ave Unit P6
- 129 Metropolitan Ave Unit P4
- 129 Metropolitan Ave Unit P7
- 129 Metropolitan Ave Unit 3R