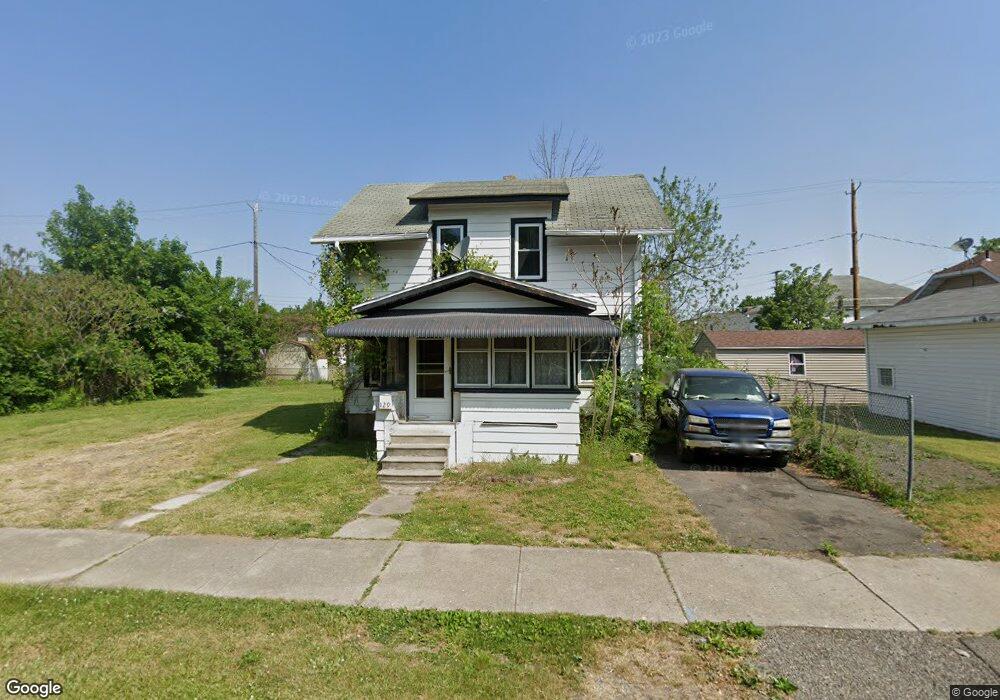
129 Morrow St Elmira, NY 14904
Estimated Value: $66,000 - $88,000
3
Beds
1
Bath
840
Sq Ft
$96/Sq Ft
Est. Value
About This Home
This home is located at 129 Morrow St, Elmira, NY 14904 and is currently estimated at $80,319, approximately $95 per square foot. 129 Morrow St is a home located in Chemung County with nearby schools including Riverside Elementary School, Parley Coburn School, and Elmira High School.
Ownership History
Date
Name
Owned For
Owner Type
Purchase Details
Closed on
Jul 23, 2024
Sold by
Decker Connie F
Bought by
Hallett Rental Properties
Current Estimated Value
Purchase Details
Closed on
Aug 15, 2011
Sold by
Nicholas Robert
Bought by
Decker Connie
Home Financials for this Owner
Home Financials are based on the most recent Mortgage that was taken out on this home.
Original Mortgage
$35,000
Interest Rate
4.62%
Mortgage Type
Purchase Money Mortgage
Purchase Details
Closed on
Dec 9, 2002
Sold by
Nicholas Robert J
Bought by
Nicholas Robert J
Purchase Details
Closed on
Jun 18, 1998
Create a Home Valuation Report for This Property
The Home Valuation Report is an in-depth analysis detailing your home's value as well as a comparison with similar homes in the area
Home Values in the Area
Average Home Value in this Area
Purchase History
| Date | Buyer | Sale Price | Title Company |
|---|---|---|---|
| Hallett Rental Properties | $34,000 | None Available | |
| Decker Connie | $35,000 | -- | |
| Decker Connie | $35,000 | -- | |
| Nicholas Robert J | -- | -- | |
| Nicholas Robert J | -- | -- | |
| -- | $12,400 | -- | |
| -- | $12,400 | -- |
Source: Public Records
Mortgage History
| Date | Status | Borrower | Loan Amount |
|---|---|---|---|
| Previous Owner | Decker Connie | $35,000 |
Source: Public Records
Tax History Compared to Growth
Tax History
| Year | Tax Paid | Tax Assessment Tax Assessment Total Assessment is a certain percentage of the fair market value that is determined by local assessors to be the total taxable value of land and additions on the property. | Land | Improvement |
|---|---|---|---|---|
| 2024 | $2,914 | $40,000 | $5,100 | $34,900 |
| 2023 | $2,340 | $40,000 | $5,100 | $34,900 |
| 2022 | $1,416 | $40,000 | $5,100 | $34,900 |
| 2021 | $793 | $40,000 | $5,100 | $34,900 |
| 2020 | $854 | $40,000 | $5,100 | $34,900 |
| 2019 | $462 | $40,000 | $5,100 | $34,900 |
| 2018 | $2,279 | $40,000 | $5,100 | $34,900 |
| 2017 | $819 | $40,000 | $5,100 | $34,900 |
| 2016 | $812 | $40,000 | $5,100 | $34,900 |
| 2015 | -- | $40,000 | $5,100 | $34,900 |
| 2014 | -- | $40,000 | $5,100 | $34,900 |
Source: Public Records
Map
Nearby Homes