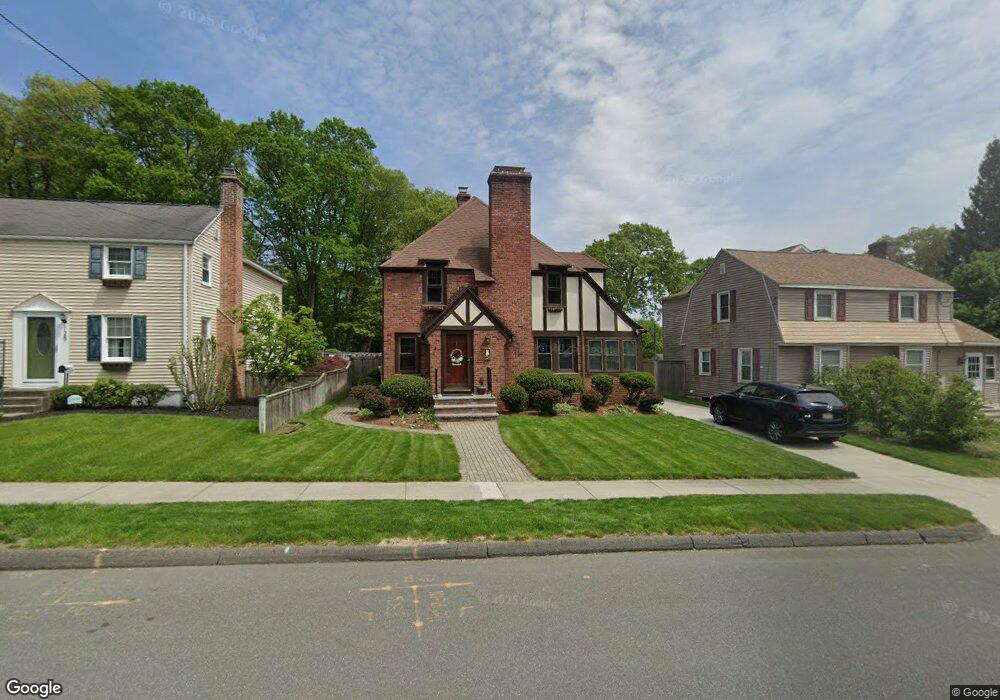
129 Nelson St West Springfield, MA 01089
Estimated Value: $336,766 - $380,000
2
Beds
1
Bath
1,440
Sq Ft
$249/Sq Ft
Est. Value
About This Home
This home is located at 129 Nelson St, West Springfield, MA 01089 and is currently estimated at $358,692, approximately $249 per square foot. 129 Nelson St is a home located in Hampden County with nearby schools including West Springfield High School and St Thomas The Apostle School.
Ownership History
Date
Name
Owned For
Owner Type
Purchase Details
Closed on
May 23, 2023
Sold by
Hennessy Maureen
Bought by
Hennessy Ft
Current Estimated Value
Purchase Details
Closed on
Dec 31, 2019
Sold by
Hennessy Richard E
Bought by
Hennessy Maureen
Home Financials for this Owner
Home Financials are based on the most recent Mortgage that was taken out on this home.
Original Mortgage
$162,000
Interest Rate
3.6%
Mortgage Type
New Conventional
Purchase Details
Closed on
Oct 30, 1992
Sold by
Drewnowski Michael W and Drewnowski Donna L
Bought by
Hennessy Richard E
Home Financials for this Owner
Home Financials are based on the most recent Mortgage that was taken out on this home.
Original Mortgage
$115,800
Interest Rate
7.85%
Mortgage Type
Purchase Money Mortgage
Create a Home Valuation Report for This Property
The Home Valuation Report is an in-depth analysis detailing your home's value as well as a comparison with similar homes in the area
Home Values in the Area
Average Home Value in this Area
Purchase History
| Date | Buyer | Sale Price | Title Company |
|---|---|---|---|
| Hennessy Ft | -- | None Available | |
| Hennessy Ft | -- | None Available | |
| Hennessy Maureen | -- | None Available | |
| Hennessy Richard E | $121,950 | -- |
Source: Public Records
Mortgage History
| Date | Status | Borrower | Loan Amount |
|---|---|---|---|
| Previous Owner | Hennessy Maureen | $162,000 | |
| Previous Owner | Hennessy Richard E | $105,000 | |
| Previous Owner | Hennessy Richard E | $115,800 |
Source: Public Records
Tax History
| Year | Tax Paid | Tax Assessment Tax Assessment Total Assessment is a certain percentage of the fair market value that is determined by local assessors to be the total taxable value of land and additions on the property. | Land | Improvement |
|---|---|---|---|---|
| 2025 | $4,275 | $287,500 | $107,100 | $180,400 |
| 2024 | $4,061 | $274,200 | $107,100 | $167,100 |
| 2023 | $3,907 | $251,400 | $107,100 | $144,300 |
| 2022 | $3,574 | $226,800 | $97,200 | $129,600 |
| 2021 | $3,721 | $220,200 | $89,300 | $130,900 |
| 2020 | $3,666 | $215,800 | $89,300 | $126,500 |
| 2019 | $3,660 | $215,800 | $89,300 | $126,500 |
| 2018 | $3,679 | $215,800 | $89,300 | $126,500 |
| 2017 | $3,679 | $215,800 | $89,300 | $126,500 |
| 2016 | $3,649 | $214,800 | $85,900 | $128,900 |
| 2015 | $3,580 | $210,700 | $84,200 | $126,500 |
| 2014 | $869 | $210,700 | $84,200 | $126,500 |
Source: Public Records
Map
Nearby Homes
Your Personal Tour Guide
Ask me questions while you tour the home.