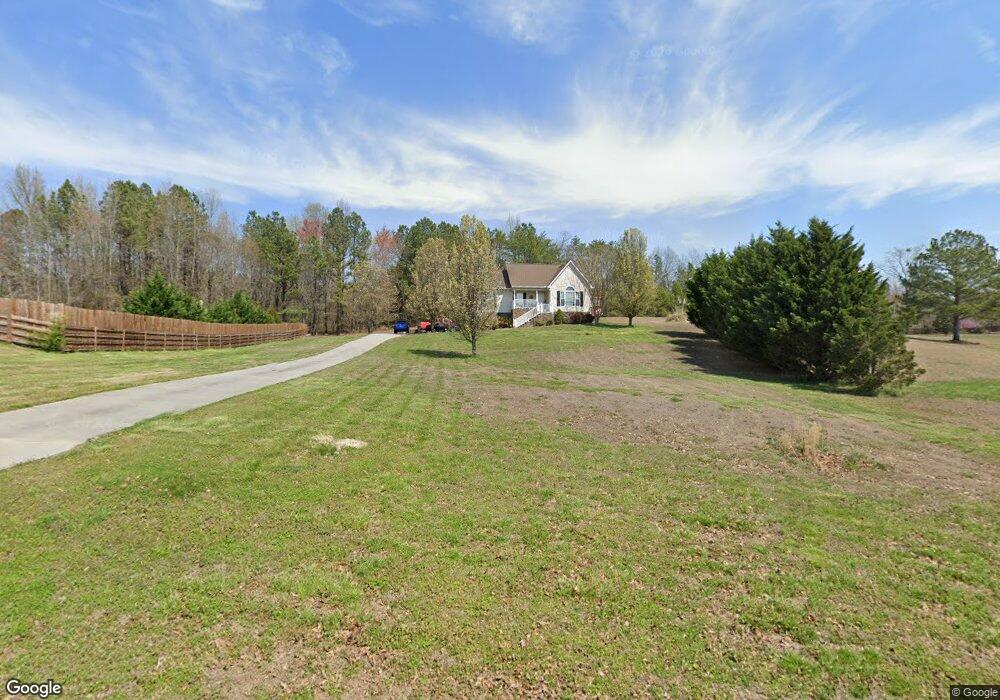
129 Oak Meadow Dr Unit 6 Rock Spring, GA 30739
Rock Spring NeighborhoodEstimated Value: $270,298 - $309,000
--
Bed
2
Baths
1,374
Sq Ft
$214/Sq Ft
Est. Value
About This Home
This home is located at 129 Oak Meadow Dr Unit 6, Rock Spring, GA 30739 and is currently estimated at $293,825, approximately $213 per square foot. 129 Oak Meadow Dr Unit 6 is a home located in Walker County with nearby schools including Rock Spring Elementary School, Lafayette High School, and Alice M Daley Adventist School.
Ownership History
Date
Name
Owned For
Owner Type
Purchase Details
Closed on
Jul 20, 2012
Sold by
Sec Of Housing & U
Bought by
Dean Kenneth
Current Estimated Value
Home Financials for this Owner
Home Financials are based on the most recent Mortgage that was taken out on this home.
Original Mortgage
$127,085
Outstanding Balance
$88,057
Interest Rate
3.75%
Mortgage Type
FHA
Estimated Equity
$205,768
Purchase Details
Closed on
Nov 1, 2011
Sold by
Murray David
Purchase Details
Closed on
May 26, 2006
Sold by
Not Provided
Bought by
Murray David
Home Financials for this Owner
Home Financials are based on the most recent Mortgage that was taken out on this home.
Original Mortgage
$115,920
Interest Rate
6.5%
Mortgage Type
New Conventional
Purchase Details
Closed on
Jun 27, 2005
Sold by
Bill Otting Inc
Bought by
O F Enterprises Lllp
Purchase Details
Closed on
Aug 25, 2003
Bought by
Otting Bill Inc
Create a Home Valuation Report for This Property
The Home Valuation Report is an in-depth analysis detailing your home's value as well as a comparison with similar homes in the area
Home Values in the Area
Average Home Value in this Area
Purchase History
| Date | Buyer | Sale Price | Title Company |
|---|---|---|---|
| Dean Kenneth | $130,500 | -- | |
| -- | $162,000 | -- | |
| Sec Of Housing & Urban | $145,973 | -- | |
| Murray David | $144,900 | -- | |
| O F Enterprises Lllp | $26,500 | -- | |
| Otting Bill Inc | $183,400 | -- |
Source: Public Records
Mortgage History
| Date | Status | Borrower | Loan Amount |
|---|---|---|---|
| Open | Dean Kenneth | $127,085 | |
| Previous Owner | Murray David | $115,920 | |
| Previous Owner | Murray David | $28,980 |
Source: Public Records
Tax History Compared to Growth
Tax History
| Year | Tax Paid | Tax Assessment Tax Assessment Total Assessment is a certain percentage of the fair market value that is determined by local assessors to be the total taxable value of land and additions on the property. | Land | Improvement |
|---|---|---|---|---|
| 2024 | $2,193 | $98,536 | $10,000 | $88,536 |
| 2023 | $2,132 | $93,630 | $10,000 | $83,630 |
| 2022 | $2,041 | $81,938 | $10,000 | $71,938 |
| 2021 | $1,664 | $59,392 | $10,000 | $49,392 |
| 2020 | $1,433 | $48,556 | $10,000 | $38,556 |
| 2019 | $1,459 | $48,556 | $10,000 | $38,556 |
| 2018 | $1,285 | $48,556 | $10,000 | $38,556 |
| 2017 | $1,592 | $48,556 | $10,000 | $38,556 |
| 2016 | $1,318 | $48,556 | $10,000 | $38,556 |
| 2015 | $1,506 | $52,826 | $10,000 | $42,826 |
| 2014 | $1,398 | $52,826 | $10,000 | $42,826 |
| 2013 | -- | $52,826 | $10,000 | $42,826 |
Source: Public Records
Map
Nearby Homes
- 23 Oak Meadow Dr
- 106 Meadow Oak Dr
- 5062 Georgia 95
- 1314 Mcintire Rd
- 533 Van Dell Dr
- 201 Van Dell Dr
- 0 Georgia 95
- 1052 Huffman Rd
- 57 McGaha Rd
- 0 Clyde Byrd Rd
- 0 Tarvin Rd Unit 1523862
- 1585 E Reed Rd
- 287 E Teems Rd
- 200 Ash Ln
- 7606 Highway 95
- 450 Arnold Ln
- 218 Golden Oaks Dr
- 0 Temperance Hall Rd Unit 10506446
- 0 Temperance Hall Rd Unit 1510568
- 1934 Round Pond Rd
- 129 Oak Meadow Dr
- 117 Oak Meadow Dr Unit 5
- 117 Oak Meadow Dr
- 117 Oak Meadow Dr Unit LOT 5
- 134 Oak Meadow Dr
- 135 Maple Leaf Dr
- 177 Oak Meadow Dr Unit LOT 7
- 134 Meadow Oak Dr
- 39 Oak Meadow Dr
- 29 Oak Meadow Dr
- 30 Oak Meadow Dr
- 17 Oak Meadow Dr
- 18 Oak Meadow Dr
- 1 Oak Meadow Dr
- 178 Oak Meadow Dr
- 230 Misty Mountain Trail
- 19 Oak Run
- 71 Oak Meadow Dr
- 178 Meadow Oak Dr
- 138 Misty Mountain Trail