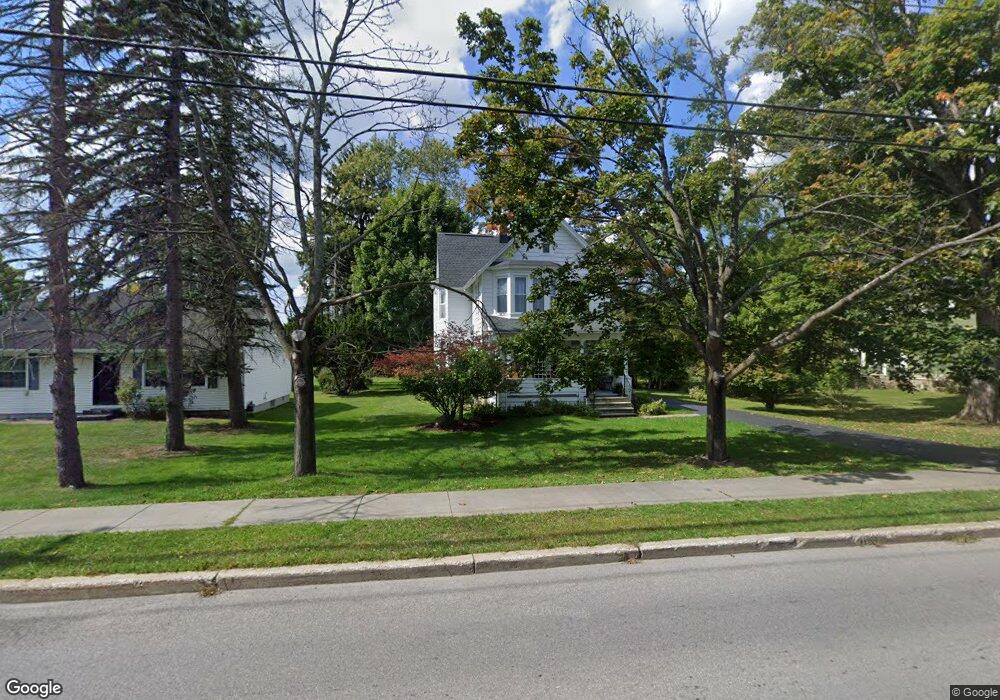
129 Olean St East Aurora, NY 14052
Estimated Value: $332,875 - $428,000
4
Beds
2
Baths
2,172
Sq Ft
$175/Sq Ft
Est. Value
About This Home
This home is located at 129 Olean St, East Aurora, NY 14052 and is currently estimated at $380,469, approximately $175 per square foot. 129 Olean St is a home located in Erie County with nearby schools including Parkdale Elementary School, East Aurora Middle School, and East Aurora High School.
Ownership History
Date
Name
Owned For
Owner Type
Purchase Details
Closed on
Nov 1, 2017
Sold by
Rapalje Charles W and Rapalje Denise B
Bought by
Martin Tara A
Current Estimated Value
Home Financials for this Owner
Home Financials are based on the most recent Mortgage that was taken out on this home.
Original Mortgage
$200,000
Outstanding Balance
$167,502
Interest Rate
3.83%
Mortgage Type
Purchase Money Mortgage
Estimated Equity
$212,967
Purchase Details
Closed on
Jul 15, 2014
Sold by
Beach David C and Lally Nanette L Beach
Bought by
Rapalje Charles W and Rapalje Denise B
Create a Home Valuation Report for This Property
The Home Valuation Report is an in-depth analysis detailing your home's value as well as a comparison with similar homes in the area
Home Values in the Area
Average Home Value in this Area
Purchase History
| Date | Buyer | Sale Price | Title Company |
|---|---|---|---|
| Martin Tara A | $200,000 | None Available | |
| Rapalje Charles W | -- | None Available |
Source: Public Records
Mortgage History
| Date | Status | Borrower | Loan Amount |
|---|---|---|---|
| Open | Martin Tara A | $200,000 |
Source: Public Records
Tax History
| Year | Tax Paid | Tax Assessment Tax Assessment Total Assessment is a certain percentage of the fair market value that is determined by local assessors to be the total taxable value of land and additions on the property. | Land | Improvement |
|---|---|---|---|---|
| 2024 | $6,359 | $61,100 | $11,400 | $49,700 |
| 2023 | $6,189 | $61,100 | $11,400 | $49,700 |
| 2022 | $6,095 | $61,100 | $11,400 | $49,700 |
| 2021 | $4,768 | $61,100 | $11,400 | $49,700 |
| 2020 | $5,084 | $61,100 | $11,400 | $49,700 |
| 2019 | $4,656 | $61,100 | $11,400 | $49,700 |
| 2018 | $5,379 | $61,100 | $11,400 | $49,700 |
| 2017 | $1,409 | $61,100 | $11,400 | $49,700 |
| 2016 | $4,709 | $58,700 | $11,400 | $47,300 |
| 2015 | -- | $58,700 | $11,400 | $47,300 |
| 2014 | -- | $58,700 | $11,400 | $47,300 |
Source: Public Records
Map
Nearby Homes
- 35 Temple Place
- 614 Crescent Ave
- 51 Paine St
- 34 Park Place
- 1005 Big Tree Rd
- 76 N Grove St
- 312 Center St
- 3 Tunbridge Walke
- 60 Byeberry Ct
- 37 Tunbridge Walke
- 139 Maple Rd
- 95 Cook Rd
- 60 Ruskin Rd
- 261 Parkdale Ave
- 260 North St
- 7 Woodbrook Dr Unit 3
- 270 Buffalo Rd Unit 27
- 270 Buffalo Rd Unit 2
- 270 Buffalo Rd Unit 1
- v/l Davis Rd
Your Personal Tour Guide
Ask me questions while you tour the home.