Estimated Value: $428,000 - $504,000
5
Beds
4
Baths
3,351
Sq Ft
$140/Sq Ft
Est. Value
About This Home
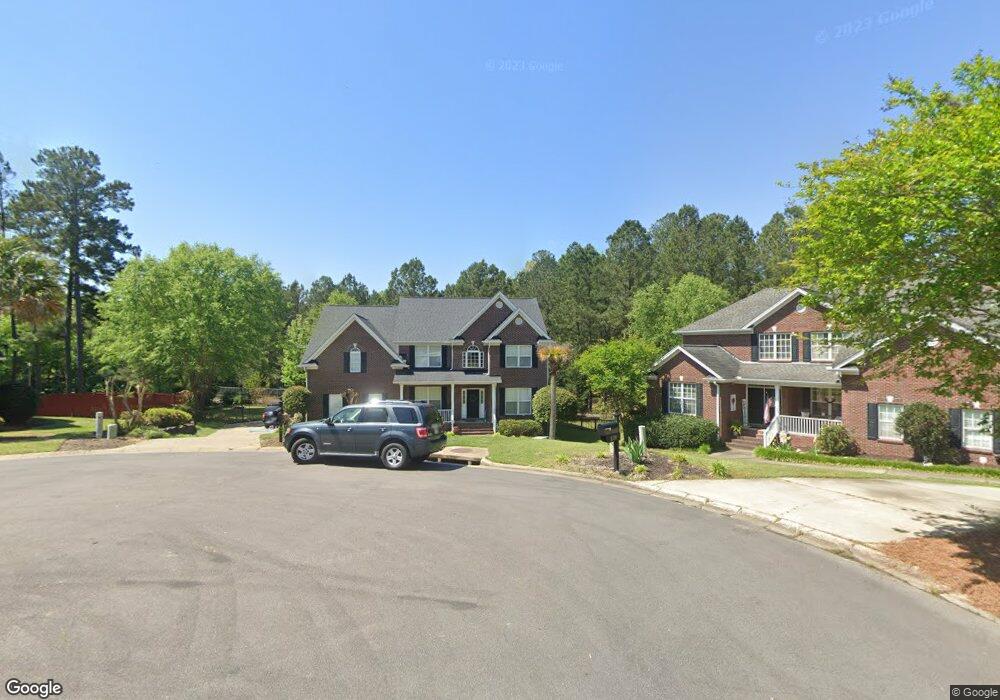
This home is located at 129 Osborne Ln, Irmo, SC 29063 and is currently estimated at $467,625, approximately $139 per square foot. 129 Osborne Ln is a home located in Richland County with nearby schools including Oak Pointe Elementary School, Dutch Fork Middle School, and Dutch Fork High School.
Ownership History
Date
Name
Owned For
Owner Type
Purchase Details
Closed on
Oct 16, 2018
Sold by
Coleman Mark A and Coleman Donna C
Bought by
Hernandez Adrian Lee and Hernandez Devon M
Current Estimated Value
Home Financials for this Owner
Home Financials are based on the most recent Mortgage that was taken out on this home.
Original Mortgage
$227,677
Outstanding Balance
$198,548
Interest Rate
4.5%
Mortgage Type
FHA
Estimated Equity
$269,077
Purchase Details
Closed on
Jun 9, 2003
Sold by
Centex Homes
Bought by
Coleman Mark A and Coleman Donna C
Home Financials for this Owner
Home Financials are based on the most recent Mortgage that was taken out on this home.
Original Mortgage
$212,037
Interest Rate
5.68%
Mortgage Type
Purchase Money Mortgage
Purchase Details
Closed on
Sep 5, 2001
Sold by
Jordan Development Co Inc
Bought by
Centex Homes
Create a Home Valuation Report for This Property
The Home Valuation Report is an in-depth analysis detailing your home's value as well as a comparison with similar homes in the area
Home Values in the Area
Average Home Value in this Area
Purchase History
| Date | Buyer | Sale Price | Title Company |
|---|---|---|---|
| Hernandez Adrian Lee | $303,225 | None Available | |
| Coleman Mark A | $265,047 | -- | |
| Centex Homes | $1,268,529 | -- |
Source: Public Records
Mortgage History
| Date | Status | Borrower | Loan Amount |
|---|---|---|---|
| Open | Hernandez Adrian Lee | $227,677 | |
| Previous Owner | Coleman Mark A | $212,037 |
Source: Public Records
Tax History Compared to Growth
Tax History
| Year | Tax Paid | Tax Assessment Tax Assessment Total Assessment is a certain percentage of the fair market value that is determined by local assessors to be the total taxable value of land and additions on the property. | Land | Improvement |
|---|---|---|---|---|
| 2024 | $2,786 | $348,700 | $0 | $0 |
| 2023 | $2,786 | $12,128 | $0 | $0 |
| 2022 | $2,412 | $303,200 | $36,800 | $266,400 |
| 2021 | $2,445 | $12,130 | $0 | $0 |
| 2020 | $2,562 | $12,130 | $0 | $0 |
| 2019 | $8,574 | $18,190 | $0 | $0 |
| 2018 | $2,215 | $11,820 | $0 | $0 |
| 2017 | $2,155 | $11,820 | $0 | $0 |
| 2016 | $2,144 | $11,820 | $0 | $0 |
| 2015 | $2,156 | $11,820 | $0 | $0 |
| 2014 | $2,151 | $295,500 | $0 | $0 |
| 2013 | -- | $11,820 | $0 | $0 |
Source: Public Records
Map
Nearby Homes
- 125 Sutton Way
- 240 Devonport Dr
- 244 Devonport Dr
- 1040 Koon Rd
- 10 Saints Creek Place
- 4 Saints Creek Place
- 116 Black Creek Ln
- 1064 Kingston Village Loop
- 108 Black Creek Ln
- 103 High Bluff Ln
- LOT 3 213 Boseman Rd
- Lot 24 295 Boseman Rd
- Lot 36 258 Boseman Rd
- Hartwell Plan at Old Tamah
- The Congaree Plan at Old Tamah
- Moultrie II Plan at Old Tamah
- The Elloree Plan at Old Tamah
- The Brier Plan at Old Tamah
- Florence Plan at Old Tamah
- The Lancaster Plan at Old Tamah
- 127 Osborne Ln
- 128 Osborne Ln
- 125 Osborne Ln
- 124 Osborne Ln
- 210 Bronlow Dr
- 208 Bronlow Dr
- 122 Osborne Ln
- 212 Bronlow Dr
- 123 Osborne Ln
- 216 Bronlow Dr
- 214 Bronlow Dr
- 107 Hope Creek Dr
- 121 Osborne Ln
- 206 Bronlow Dr
- 118 Osborne Ln
- 224 Hope Trace Way
- 218 Bronlow Dr
- 109 Hope Creek Dr
- 1305 Koon Rd
- 222 Hope Trace Way