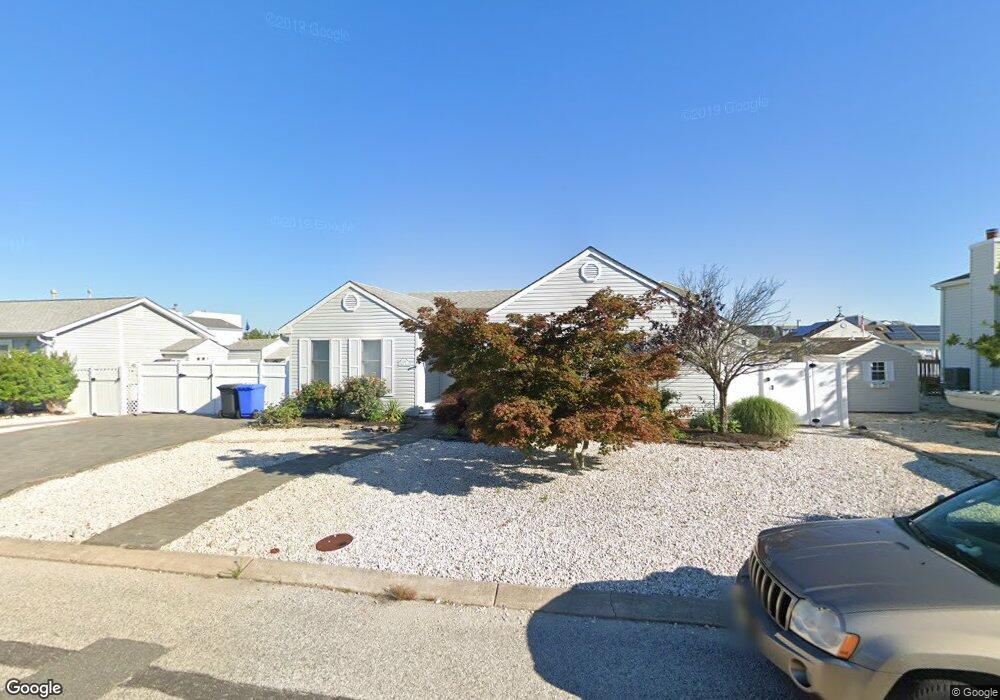
129 Peter Rd Manahawkin, NJ 08050
Stafford NeighborhoodEstimated Value: $796,250 - $906,000
4
Beds
2
Baths
1,426
Sq Ft
$597/Sq Ft
Est. Value
About This Home
This home is located at 129 Peter Rd, Manahawkin, NJ 08050 and is currently estimated at $851,563, approximately $597 per square foot. 129 Peter Rd is a home located in Ocean County with nearby schools including Oxycocus Elementary School, Ocean Acres Elementary School, and McKinley Avenue Elementary School.
Ownership History
Date
Name
Owned For
Owner Type
Purchase Details
Closed on
Nov 15, 2007
Sold by
Perrone Angela M
Bought by
Kohler John M and Decicco Kohler Betty
Current Estimated Value
Purchase Details
Closed on
Dec 18, 1998
Sold by
Alstodt Harold and Alstodt Alberta
Bought by
Fiebert Jack and Fiebert Diane
Home Financials for this Owner
Home Financials are based on the most recent Mortgage that was taken out on this home.
Original Mortgage
$144,000
Interest Rate
6.89%
Create a Home Valuation Report for This Property
The Home Valuation Report is an in-depth analysis detailing your home's value as well as a comparison with similar homes in the area
Home Values in the Area
Average Home Value in this Area
Purchase History
| Date | Buyer | Sale Price | Title Company |
|---|---|---|---|
| Kohler John M | $530,000 | Ticor Title Insurance Co | |
| Fiebert Jack | $160,000 | Old Republic Natl Title Ins |
Source: Public Records
Mortgage History
| Date | Status | Borrower | Loan Amount |
|---|---|---|---|
| Previous Owner | Fiebert Jack | $144,000 |
Source: Public Records
Tax History Compared to Growth
Tax History
| Year | Tax Paid | Tax Assessment Tax Assessment Total Assessment is a certain percentage of the fair market value that is determined by local assessors to be the total taxable value of land and additions on the property. | Land | Improvement |
|---|---|---|---|---|
| 2025 | $7,509 | $302,400 | $198,700 | $103,700 |
| 2024 | $7,436 | $302,400 | $198,700 | $103,700 |
| 2023 | $7,119 | $302,400 | $198,700 | $103,700 |
| 2022 | $7,119 | $302,400 | $198,700 | $103,700 |
| 2021 | $7,022 | $302,400 | $198,700 | $103,700 |
| 2020 | $7,031 | $302,400 | $198,700 | $103,700 |
| 2019 | $6,931 | $302,400 | $198,700 | $103,700 |
| 2018 | $6,889 | $302,400 | $198,700 | $103,700 |
| 2017 | $7,395 | $314,300 | $179,800 | $134,500 |
| 2016 | $7,320 | $314,300 | $179,800 | $134,500 |
| 2015 | $7,062 | $314,300 | $179,800 | $134,500 |
| 2014 | $6,973 | $306,500 | $177,400 | $129,100 |
Source: Public Records
Map
Nearby Homes