Estimated Value: $344,000 - $415,000
3
Beds
2
Baths
1,889
Sq Ft
$204/Sq Ft
Est. Value
About This Home
This home is located at 129 Promise Ln, Ewing, KY 41039 and is currently estimated at $385,564, approximately $204 per square foot. 129 Promise Ln is a home located in Fleming County with nearby schools including Fleming County High School.
Ownership History
Date
Name
Owned For
Owner Type
Purchase Details
Closed on
Nov 11, 2013
Sold by
Sanders Alan and Sanders Nancy L
Bought by
Hunt Anthony and Hunt Dana
Current Estimated Value
Home Financials for this Owner
Home Financials are based on the most recent Mortgage that was taken out on this home.
Original Mortgage
$168,000
Interest Rate
4.23%
Mortgage Type
Commercial
Purchase Details
Closed on
Nov 4, 2013
Sold by
Anthony Anthony and Hunt Dana
Bought by
Bryant Chad M and Bryant Sarah M
Home Financials for this Owner
Home Financials are based on the most recent Mortgage that was taken out on this home.
Original Mortgage
$168,000
Interest Rate
4.23%
Mortgage Type
Commercial
Purchase Details
Closed on
Feb 8, 2008
Sold by
Brown Steven D and Brown
Bought by
Hunt Anthony and Hunt Dana
Create a Home Valuation Report for This Property
The Home Valuation Report is an in-depth analysis detailing your home's value as well as a comparison with similar homes in the area
Home Values in the Area
Average Home Value in this Area
Purchase History
| Date | Buyer | Sale Price | Title Company |
|---|---|---|---|
| Hunt Anthony | $15,000 | -- | |
| Bryant Chad M | $210,000 | -- | |
| Hunt Anthony | $35,000 | -- |
Source: Public Records
Mortgage History
| Date | Status | Borrower | Loan Amount |
|---|---|---|---|
| Previous Owner | Bryant Chad M | $168,000 |
Source: Public Records
Tax History Compared to Growth
Tax History
| Year | Tax Paid | Tax Assessment Tax Assessment Total Assessment is a certain percentage of the fair market value that is determined by local assessors to be the total taxable value of land and additions on the property. | Land | Improvement |
|---|---|---|---|---|
| 2025 | $2,447 | $252,000 | $50,000 | $202,000 |
| 2024 | $2,480 | $252,000 | $50,000 | $202,000 |
| 2023 | $2,525 | $252,000 | $50,000 | $202,000 |
| 2022 | $2,520 | $252,000 | $50,000 | $202,000 |
| 2021 | $2,161 | $210,000 | $50,000 | $160,000 |
| 2020 | $2,164 | $210,000 | $50,000 | $160,000 |
| 2019 | $2,138 | $210,000 | $50,000 | $160,000 |
| 2018 | $2,036 | $210,000 | $50,000 | $160,000 |
| 2017 | $2,032 | $210,000 | $50,000 | $160,000 |
| 2016 | $2,027 | $210,000 | $50,000 | $160,000 |
| 2015 | $2,014 | $210,000 | $50,000 | $160,000 |
| 2012 | $1,716 | $190,000 | $190,000 | $0 |
Source: Public Records
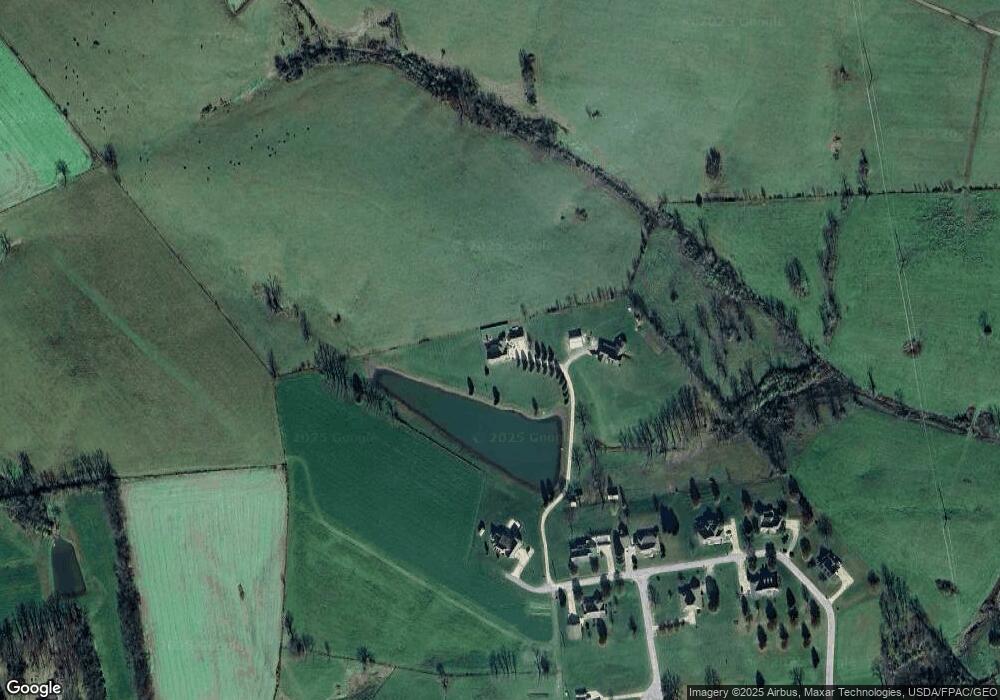
Map
Nearby Homes
- 296 Cassidy Pike
- 500-600 Cassidy Pike
- 0 Bypass Blvd
- 0 Frazier St
- 0 Sellers St
- 122 Lake Point Dr
- 133 Tulip Poplar - Lot 5 Ln
- 418 Dye St
- 904 W Water St
- 19 Russell St
- 294 W West Water St
- 294 W Water St
- 57 Dorothy St
- 232 Mills Ave
- 115 Highland Dr
- 115 Elizaville Ave
- 61 Emmons Ln
- 127 Mills Ave
- 330 Crest Ave
- 205 Highridge Dr
- 288 Hunter Trace Dr
- 130 Promise Ln
- 250 Hunter Trace Dr
- 291 Hunter Trace Dr
- 314 Hunter Trace Dr
- 216 Hunter Trace Dr
- 237 Hunter Trace Dr
- 184 Hunter Trace Dr
- 80 Mallard
- 189 Hunter Trace Dr
- 158 Hunter Trace Dr
- 2208 Elizaville Rd
- 2102 Elizaville Rd
- 2074 Elizaville Rd
- 2044 Elizaville Rd
- 2402 Elizaville Rd
- 2524 Elizaville Rd
- 2020 Elizaville Rd
- 2411 Elizaville Rd
- 1942 Elizaville Rd