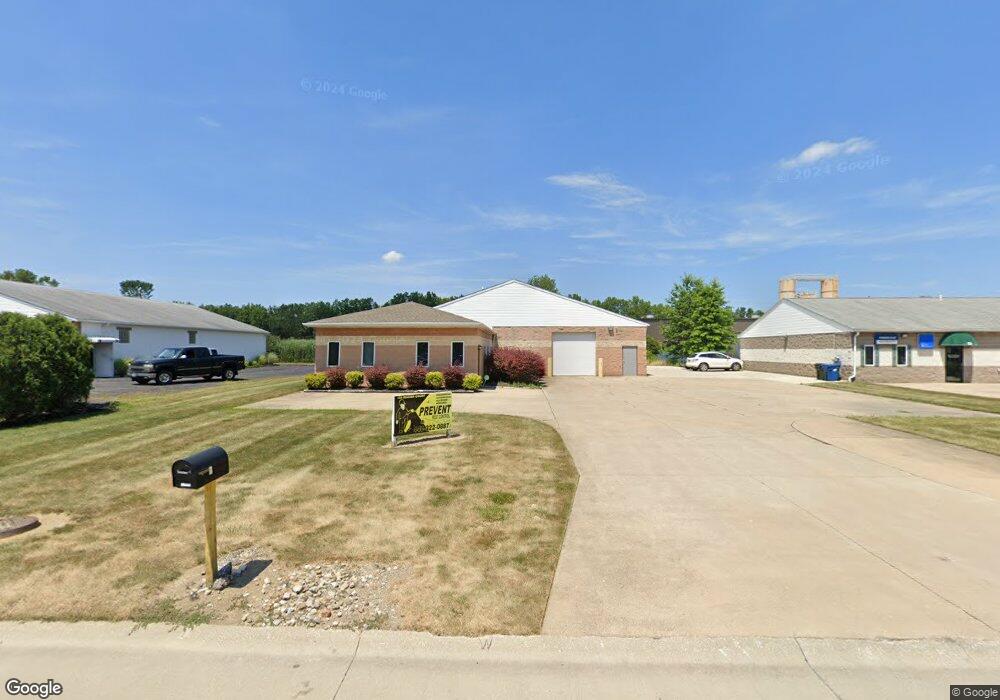
129 Reaser Ct Elyria, OH 44035
Estimated Value: $539,149
Studio
--
Bath
4,900
Sq Ft
$110/Sq Ft
Est. Value
About This Home
This home is located at 129 Reaser Ct, Elyria, OH 44035 and is currently estimated at $539,149, approximately $110 per square foot. 129 Reaser Ct is a home located in Lorain County with nearby schools including Eastern Heights Middle School, Elyria High School, and Lake Ridge Academy.
Ownership History
Date
Name
Owned For
Owner Type
Purchase Details
Closed on
Jan 4, 2023
Sold by
Jed Investments Llc
Bought by
Malawyk Re Llc
Current Estimated Value
Home Financials for this Owner
Home Financials are based on the most recent Mortgage that was taken out on this home.
Original Mortgage
$361,250
Outstanding Balance
$348,492
Interest Rate
6.58%
Mortgage Type
New Conventional
Estimated Equity
$190,657
Purchase Details
Closed on
Nov 30, 2022
Sold by
Stintsman Properties Llc
Bought by
Jed Investments Llc
Home Financials for this Owner
Home Financials are based on the most recent Mortgage that was taken out on this home.
Original Mortgage
$361,250
Outstanding Balance
$348,492
Interest Rate
6.58%
Mortgage Type
New Conventional
Estimated Equity
$190,657
Purchase Details
Closed on
Mar 3, 2014
Sold by
Gentile Giuseppe and Gentile Francesca
Bought by
Stintsman Properties Llc
Create a Home Valuation Report for This Property
The Home Valuation Report is an in-depth analysis detailing your home's value as well as a comparison with similar homes in the area
Home Values in the Area
Average Home Value in this Area
Purchase History
| Date | Buyer | Sale Price | Title Company |
|---|---|---|---|
| Malawyk Re Llc | $425,000 | First American Title | |
| Jed Investments Llc | $350,000 | -- | |
| Stintsman Properties Llc | $240,000 | None Available |
Source: Public Records
Mortgage History
| Date | Status | Borrower | Loan Amount |
|---|---|---|---|
| Open | Malawyk Re Llc | $361,250 |
Source: Public Records
Tax History
| Year | Tax Paid | Tax Assessment Tax Assessment Total Assessment is a certain percentage of the fair market value that is determined by local assessors to be the total taxable value of land and additions on the property. | Land | Improvement |
|---|---|---|---|---|
| 2024 | $8,268 | $137,578 | $37,538 | $100,041 |
| 2023 | $6,124 | $84,228 | $9,625 | $74,603 |
| 2022 | $6,091 | $84,228 | $9,625 | $74,603 |
| 2021 | $6,144 | $84,228 | $9,625 | $74,603 |
| 2020 | $6,387 | $84,230 | $9,630 | $74,600 |
| 2019 | $6,324 | $84,230 | $9,630 | $74,600 |
| 2018 | $6,255 | $84,230 | $9,630 | $74,600 |
| 2017 | $6,640 | $84,000 | $8,750 | $75,250 |
| 2016 | $6,540 | $84,000 | $8,750 | $75,250 |
| 2015 | $6,159 | $84,000 | $8,750 | $75,250 |
| 2014 | $4,738 | $65,550 | $8,750 | $56,800 |
| 2013 | $4,657 | $65,550 | $8,750 | $56,800 |
Source: Public Records
Map
Nearby Homes
- 340 Boston Ave
- 350 Concord Ave
- 800 Boston Ave
- 164 Woodbury St
- 828 S Logan St
- 38751 Sugar Ridge Rd
- 832 S Logan St
- 154 Bentley Dr
- 539 Princeton Ave
- 453 Kenyon Ave
- 232 Hawthorne St
- 147 Bellfield Ave
- 154 Bellfield Ave
- 9180 Bender Rd
- 297 Abbe Rd N
- 560 Case Ave
- 144 Roosevelt Ave
- 129 Brandtson Ave
- 123 Harwood St
- 331 Abbe Rd N
- 123 Reaser Ct
- 121 Reaser Ct
- 161 Reaser Ct
- 169 Reaser Ct
- 570 Ternes Ln
- 566 Ternes Ln
- 1154 E Broad St
- 1166 E Broad St
- 1030 E Broad St
- 1320 Taylor St
- 511 Abbe Rd S
- 503 S Abbe Rd
- 1200 E Broad St
- 535 Abbe Rd S
- 535 Abbe Rd S
- 1087 E Broad St
- 1268 E Broad St Unit 3
- 0 E Broad St Unit 697523
- 0 E Broad St Unit 657849
- 0 E Broad St Unit 639712
Your Personal Tour Guide
Ask me questions while you tour the home.