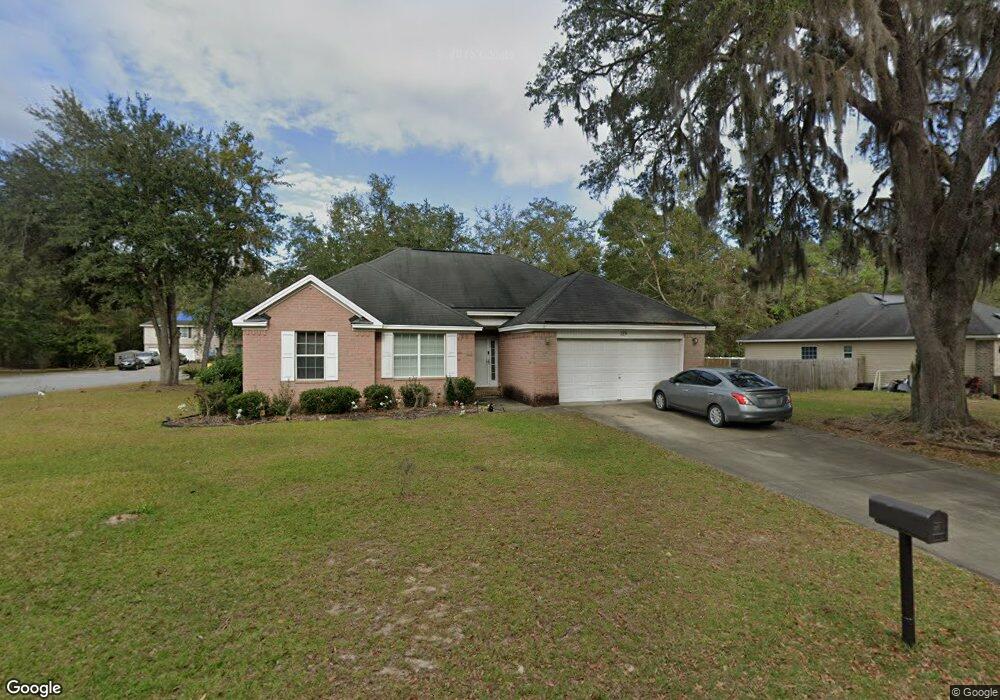
129 River Bend Dr Midway, GA 31320
Estimated Value: $254,000 - $270,000
3
Beds
2
Baths
1,454
Sq Ft
$182/Sq Ft
Est. Value
About This Home
This home is located at 129 River Bend Dr, Midway, GA 31320 and is currently estimated at $264,211, approximately $181 per square foot. 129 River Bend Dr is a home located in Liberty County with nearby schools including Liberty Elementary School, Midway Middle School, and Liberty County High School.
Ownership History
Date
Name
Owned For
Owner Type
Purchase Details
Closed on
May 24, 2019
Sold by
Renner John M
Bought by
Granger Henry
Current Estimated Value
Home Financials for this Owner
Home Financials are based on the most recent Mortgage that was taken out on this home.
Original Mortgage
$152,000
Outstanding Balance
$131,971
Interest Rate
4.2%
Mortgage Type
New Conventional
Estimated Equity
$132,240
Purchase Details
Closed on
Oct 24, 2007
Sold by
Walker Garland W
Bought by
Renner John M and Renner Karen A
Home Financials for this Owner
Home Financials are based on the most recent Mortgage that was taken out on this home.
Original Mortgage
$162,418
Interest Rate
6.37%
Purchase Details
Closed on
Dec 6, 2005
Sold by
Lopez Construction Inc
Bought by
Walker Garland W and Walker Myrtle Ellen
Home Financials for this Owner
Home Financials are based on the most recent Mortgage that was taken out on this home.
Original Mortgage
$146,686
Interest Rate
6.29%
Purchase Details
Closed on
Jun 21, 2004
Sold by
Marlo Development
Bought by
Lopez Construction Inc
Create a Home Valuation Report for This Property
The Home Valuation Report is an in-depth analysis detailing your home's value as well as a comparison with similar homes in the area
Purchase History
| Date | Buyer | Sale Price | Title Company |
|---|---|---|---|
| Granger Henry | $152,000 | -- | |
| Renner John M | $159,000 | -- | |
| Walker Garland W | $142,000 | -- | |
| Lopez Construction Inc | $500,000 | -- |
Source: Public Records
Mortgage History
| Date | Status | Borrower | Loan Amount |
|---|---|---|---|
| Open | Granger Henry | $152,000 | |
| Previous Owner | Renner John M | $162,418 | |
| Previous Owner | Walker Garland W | $146,686 |
Source: Public Records
Tax History
| Year | Tax Paid | Tax Assessment Tax Assessment Total Assessment is a certain percentage of the fair market value that is determined by local assessors to be the total taxable value of land and additions on the property. | Land | Improvement |
|---|---|---|---|---|
| 2025 | $4,189 | $100,745 | $20,000 | $80,745 |
| 2024 | $4,189 | $84,734 | $12,000 | $72,734 |
| 2023 | $3,543 | $75,970 | $12,000 | $63,970 |
| 2022 | $2,447 | $62,262 | $10,000 | $52,262 |
| 2021 | $2,244 | $57,201 | $10,000 | $47,201 |
| 2020 | $2,125 | $53,965 | $10,000 | $43,965 |
| 2019 | $2,014 | $52,439 | $10,000 | $42,439 |
| 2018 | $2,008 | $52,910 | $10,000 | $42,910 |
| 2017 | $2,329 | $54,900 | $10,000 | $44,900 |
| 2016 | $1,957 | $55,388 | $10,000 | $45,388 |
| 2015 | $2,241 | $55,388 | $10,000 | $45,388 |
| 2014 | $2,241 | $62,941 | $10,000 | $52,941 |
| 2013 | -- | $59,424 | $10,000 | $49,424 |
Source: Public Records
Map
Nearby Homes
- 146 River Bend Dr
- 327 River Bend Dr
- 12 E Red Fox Ct
- 48 W Beaver Ln
- 35 W Red Fox Ct
- 29 Arlen Dr
- 46 Delaney Ct
- 260 Arlen Dr
- 0 E Oglethorpe Unit SA341930
- 0 E Oglethorpe Unit 153327
- 0 E Oglethorpe Unit 10592168
- 0 E Oglethorpe Unit SA350017
- 0 E Oglethorpe Unit SA350025
- 8701 E Oglethorpe Hwy
- 0000 E Oglethorpe Hwy
- 182 Gloucester Dr
- 29 Sassafras Ln
- 0 S Coastal Hwy
- 135 Kettle Creek Ln
- 51 Lachlan Ln
- 42 Mulberry Run Ct
- 111 River Bend Dr
- 31 Mulberry Run Ct
- 155 River Bend Dr
- 128 River Bend Dr
- 93 River Bend Dr
- 41 Mulberry Run Ct
- 108 River Bend Dr
- 164 River Bend Dr
- 173 River Bend Dr
- 30 Mulberry Run Ct
- 92 River Bend Dr
- 73 River Bend Dr
- 78 E Deer Ct
- 182 River Bend Dr
- 56 E Deer Ct
- 100 E Deer Ct
- 29 Carolina Ash Ct
- 34 E Deer Ct
- 72 River Bend Dr
Your Personal Tour Guide
Ask me questions while you tour the home.