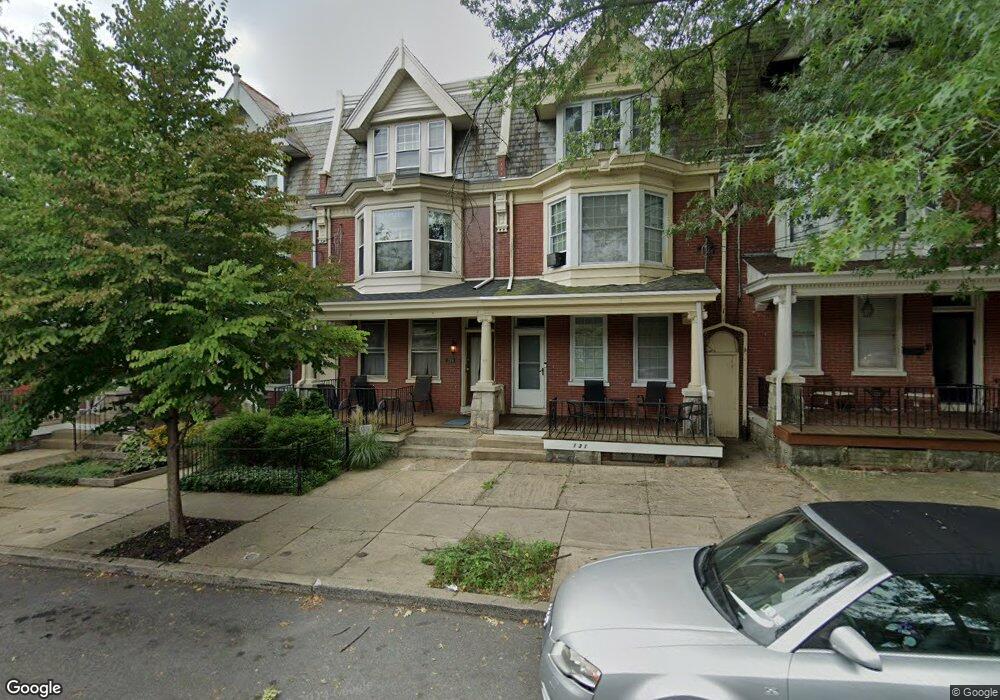
129 Ruby St Lancaster, PA 17603
West End NeighborhoodEstimated Value: $264,000 - $313,000
5
Beds
1
Bath
2,016
Sq Ft
$145/Sq Ft
Est. Value
About This Home
This home is located at 129 Ruby St, Lancaster, PA 17603 and is currently estimated at $292,490, approximately $145 per square foot. 129 Ruby St is a home located in Lancaster County with nearby schools including Smith-Wade-El Elementary School, Wheatland Middle School, and McCaskey High School.
Ownership History
Date
Name
Owned For
Owner Type
Purchase Details
Closed on
Nov 30, 2018
Sold by
Farr Susan L and Farr Melissa L
Bought by
Groff James C and Farr Melissa L
Current Estimated Value
Purchase Details
Closed on
Feb 25, 2011
Sold by
Bushong Ned E and Bushong Jennifer
Bought by
Farr Susan L and Farr Melissa L
Home Financials for this Owner
Home Financials are based on the most recent Mortgage that was taken out on this home.
Original Mortgage
$116,958
Outstanding Balance
$80,210
Interest Rate
4.75%
Mortgage Type
FHA
Estimated Equity
$212,280
Purchase Details
Closed on
Dec 20, 2002
Sold by
Cover Bernard L and Cover Patricia R
Bought by
Bushong Ned E
Home Financials for this Owner
Home Financials are based on the most recent Mortgage that was taken out on this home.
Original Mortgage
$86,813
Interest Rate
6.18%
Mortgage Type
FHA
Create a Home Valuation Report for This Property
The Home Valuation Report is an in-depth analysis detailing your home's value as well as a comparison with similar homes in the area
Home Values in the Area
Average Home Value in this Area
Purchase History
| Date | Buyer | Sale Price | Title Company |
|---|---|---|---|
| Groff James C | -- | None Available | |
| Farr Susan L | $120,000 | None Available | |
| Bushong Ned E | $87,500 | -- |
Source: Public Records
Mortgage History
| Date | Status | Borrower | Loan Amount |
|---|---|---|---|
| Open | Farr Susan L | $116,958 | |
| Previous Owner | Bushong Ned E | $86,813 |
Source: Public Records
Tax History
| Year | Tax Paid | Tax Assessment Tax Assessment Total Assessment is a certain percentage of the fair market value that is determined by local assessors to be the total taxable value of land and additions on the property. | Land | Improvement |
|---|---|---|---|---|
| 2025 | $4,467 | $112,900 | $23,300 | $89,600 |
| 2024 | $4,467 | $112,900 | $23,300 | $89,600 |
| 2023 | $4,209 | $112,900 | $23,300 | $89,600 |
| 2022 | $4,209 | $112,900 | $23,300 | $89,600 |
| 2021 | $4,119 | $112,900 | $23,300 | $89,600 |
| 2020 | $4,119 | $112,900 | $23,300 | $89,600 |
| 2019 | $4,057 | $112,900 | $23,300 | $89,600 |
| 2018 | $1,971 | $112,900 | $23,300 | $89,600 |
| 2017 | $2,958 | $64,400 | $16,200 | $48,200 |
| 2016 | $2,931 | $64,400 | $16,200 | $48,200 |
| 2015 | $1,143 | $64,400 | $16,200 | $48,200 |
| 2014 | $2,131 | $64,400 | $16,200 | $48,200 |
Source: Public Records
Map
Nearby Homes
Your Personal Tour Guide
Ask me questions while you tour the home.