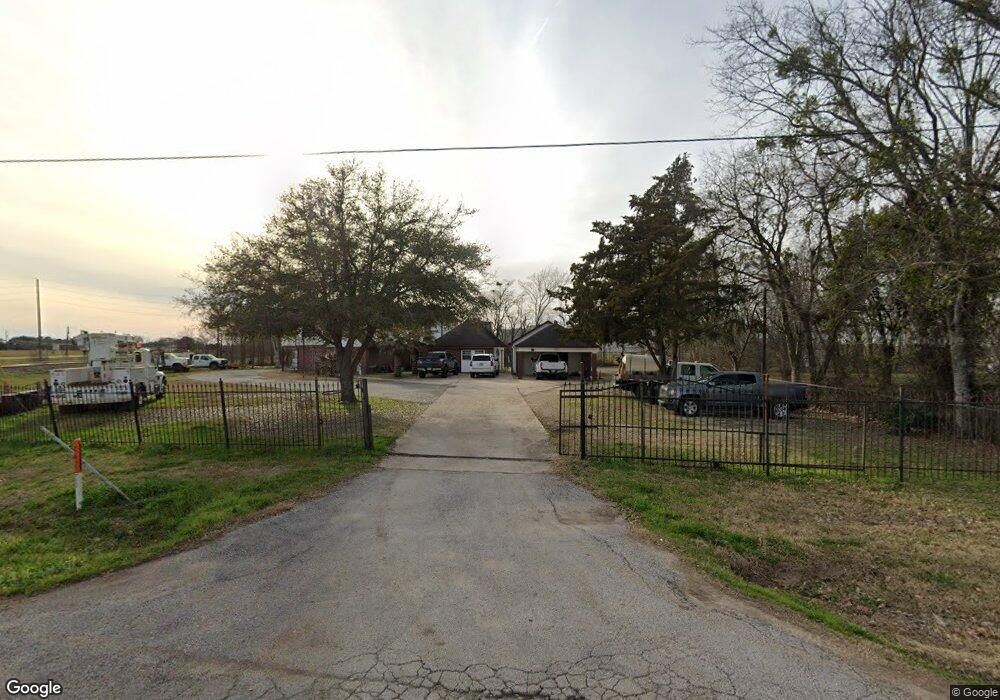
129 Rude St Rosenberg, TX 77471
Estimated Value: $363,000 - $445,000
4
Beds
4
Baths
2,176
Sq Ft
$183/Sq Ft
Est. Value
About This Home
This home is located at 129 Rude St, Rosenberg, TX 77471 and is currently estimated at $397,964, approximately $182 per square foot. 129 Rude St is a home located in Fort Bend County with nearby schools including Bowie Elementary School, Navarro Middle School, and George Junior High School.
Ownership History
Date
Name
Owned For
Owner Type
Purchase Details
Closed on
Sep 5, 2020
Sold by
Gonzales Jose A and Gonzales Elida Rachel
Bought by
Hernandez Alberto and Rodas Marisela
Current Estimated Value
Purchase Details
Closed on
Sep 25, 2019
Sold by
Needville Tree Farm Property 1 Llc
Bought by
Hernandez Alberto and Gallardo Glenda Rodas
Home Financials for this Owner
Home Financials are based on the most recent Mortgage that was taken out on this home.
Original Mortgage
$103,409
Interest Rate
3.6%
Mortgage Type
New Conventional
Purchase Details
Closed on
Jan 23, 2015
Sold by
Garza Melisa Gomez and Morales Marco
Bought by
Hernandez Alberto and Gallardo Glenda
Purchase Details
Closed on
Oct 3, 2012
Sold by
Lerma Salustrio J and Lerma Lorenza
Bought by
Hernandez Alberto and Glenda Gallardo
Create a Home Valuation Report for This Property
The Home Valuation Report is an in-depth analysis detailing your home's value as well as a comparison with similar homes in the area
Home Values in the Area
Average Home Value in this Area
Purchase History
| Date | Buyer | Sale Price | Title Company |
|---|---|---|---|
| Hernandez Alberto | -- | Stewart Title | |
| Hernandez Alberto | -- | Select Title Llc | |
| Hernandez Alberto | -- | Startex Title Co Llc | |
| Hernandez Alberto | -- | -- |
Source: Public Records
Mortgage History
| Date | Status | Borrower | Loan Amount |
|---|---|---|---|
| Previous Owner | Hernandez Alberto | $103,409 |
Source: Public Records
Tax History Compared to Growth
Tax History
| Year | Tax Paid | Tax Assessment Tax Assessment Total Assessment is a certain percentage of the fair market value that is determined by local assessors to be the total taxable value of land and additions on the property. | Land | Improvement |
|---|---|---|---|---|
| 2025 | $6,653 | $342,330 | $52,598 | $289,732 |
| 2024 | $6,653 | $352,240 | $52,598 | $299,642 |
| 2023 | $6,861 | $355,398 | $52,598 | $302,800 |
| 2022 | $6,675 | $325,910 | $52,600 | $273,310 |
| 2021 | $5,724 | $275,900 | $52,600 | $223,300 |
| 2020 | $5,964 | $281,020 | $52,600 | $228,420 |
| 2019 | $6,216 | $272,170 | $52,600 | $219,570 |
| 2018 | $6,060 | $261,080 | $52,600 | $208,480 |
| 2017 | $5,003 | $214,340 | $52,600 | $161,740 |
| 2016 | $4,943 | $211,790 | $52,600 | $159,190 |
| 2015 | $3,605 | $176,780 | $52,600 | $124,180 |
| 2014 | $3,425 | $160,710 | $52,600 | $108,110 |
Source: Public Records
Map
Nearby Homes
- 805 Avenue J
- 206 Timothy Trail
- 217 Timothy Trail
- 1112 James St
- 3326 Tilley Dr
- 915 Avenue E
- 735 Willow St
- 503 Willow St
- 1210 Avenue E
- 802 Matamoros Dr
- 1220 Mulcahy St
- 428 West St
- 614 Mulcahy St
- 1400 Dyer Ave
- 1418 Carlisle St
- 1208 Klare Ave
- 1613 Mulcahy St
- 1108 Easy St
- 2606 Wastelbread Ln
- 2523 Good Morrow Dr