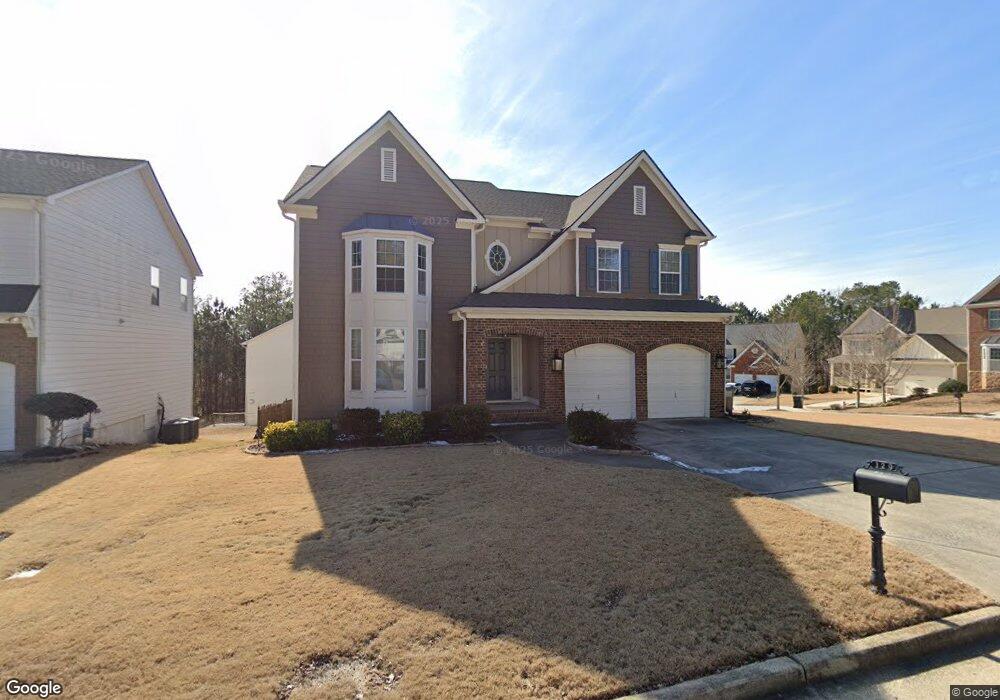
129 Ryans Point Dallas, GA 30132
Cedarcrest NeighborhoodEstimated Value: $427,744 - $499,000
5
Beds
3
Baths
3,414
Sq Ft
$134/Sq Ft
Est. Value
About This Home
This home is located at 129 Ryans Point, Dallas, GA 30132 and is currently estimated at $457,186, approximately $133 per square foot. 129 Ryans Point is a home located in Paulding County with nearby schools including Floyd L. Shelton Elementary School at Crossroad, Sammy Mcclure Sr. Middle School, and North Paulding High School.
Ownership History
Date
Name
Owned For
Owner Type
Purchase Details
Closed on
Oct 4, 2021
Sold by
Davis Sarah
Bought by
Davis Jerome
Current Estimated Value
Home Financials for this Owner
Home Financials are based on the most recent Mortgage that was taken out on this home.
Original Mortgage
$275,000
Outstanding Balance
$248,587
Interest Rate
2.8%
Mortgage Type
New Conventional
Estimated Equity
$208,599
Purchase Details
Closed on
Aug 26, 2010
Sold by
Klingman Andrew
Bought by
Davis Sarah and Davis Jerome
Home Financials for this Owner
Home Financials are based on the most recent Mortgage that was taken out on this home.
Original Mortgage
$172,674
Interest Rate
4.25%
Mortgage Type
FHA
Purchase Details
Closed on
Sep 25, 2007
Sold by
D R Horton Inc
Bought by
Klingman Andrew
Home Financials for this Owner
Home Financials are based on the most recent Mortgage that was taken out on this home.
Original Mortgage
$286,874
Interest Rate
6.49%
Mortgage Type
New Conventional
Purchase Details
Closed on
Dec 13, 2006
Sold by
The Landon Group Inc
Create a Home Valuation Report for This Property
The Home Valuation Report is an in-depth analysis detailing your home's value as well as a comparison with similar homes in the area
Home Values in the Area
Average Home Value in this Area
Purchase History
| Date | Buyer | Sale Price | Title Company |
|---|---|---|---|
| Davis Jerome | -- | -- | |
| Davis Sarah | $175,000 | -- | |
| Klingman Andrew | $286,900 | -- | |
| -- | $286,900 | -- | |
| -- | $77,700 | -- |
Source: Public Records
Mortgage History
| Date | Status | Borrower | Loan Amount |
|---|---|---|---|
| Open | Davis Jerome | $275,000 | |
| Previous Owner | Davis Sarah | $172,674 | |
| Previous Owner | -- | $286,874 |
Source: Public Records
Tax History
| Year | Tax Paid | Tax Assessment Tax Assessment Total Assessment is a certain percentage of the fair market value that is determined by local assessors to be the total taxable value of land and additions on the property. | Land | Improvement |
|---|---|---|---|---|
| 2025 | $4,382 | $176,148 | $20,000 | $156,148 |
| 2024 | $4,161 | $167,292 | $20,000 | $147,292 |
| 2023 | $4,577 | $175,576 | $20,000 | $155,576 |
| 2022 | $4,103 | $157,400 | $12,000 | $145,400 |
| 2021 | $3,498 | $122,240 | $12,000 | $110,240 |
| 2020 | $3,433 | $117,440 | $12,000 | $105,440 |
| 2019 | $3,147 | $106,320 | $12,000 | $94,320 |
| 2018 | $3,285 | $109,040 | $12,000 | $97,040 |
| 2017 | $3,073 | $100,600 | $10,000 | $90,600 |
Source: Public Records
Map
Nearby Homes
- 179 Leyland Crossing
- 536 Longwood Place
- 439 Longwood Place
- 425 Longwood Place
- 545 Longwood Place
- 117 Park Chase Ln
- 289 Ryans Point
- 63 Zimmer Woods Crossing
- 52 Longwood Crossing
- 45 Windflower Ct Unit 2
- 399 Katielee Cove
- 156 Alexandria Way
- 412 Oak Hills Dr
- 104 Copper Leaf Way
- 93 Branch Valley Dr
- 125 Parkmont Ct
- 26 Laurel Branch Ct
- 167 Calming Water Trail
- 221 Copper Leaf Way
- 46 Heritage Ln
- 0 Zimmer Woods Ct Unit Lot 47 8992617
- 0 Zimmer Woods Ct Unit Lot 46 8992559
- 109 Ryans Point
- 122 Ryans Point
- 43 Zimmer Woods Ct Unit LOT43
- 46 Zimmer Woods Ct
- 47 Zimmer Woods Ct
- 45 Zimmer Woods Ct
- 43 Zimmer Woods Ct
- 27 Zimmer Woods Ct
- 108 Ryans Point Unit 135
- 108 Ryans Point
- 12 Zimmer Woods Ct
- 134 Ryans Point
- 95 Ryans Point
- 31 Zimmer Woods Ct
- 31 Zimmer Woods Ct
- 31 Zimmer Woods Ct Unit 31
- 31 Zimmer Woods Ct Unit 6A
- 98 Ryans Point
Your Personal Tour Guide
Ask me questions while you tour the home.