129 S 16th St Richmond, CA 94804
Coronado NeighborhoodEstimated Value: $381,000 - $546,000
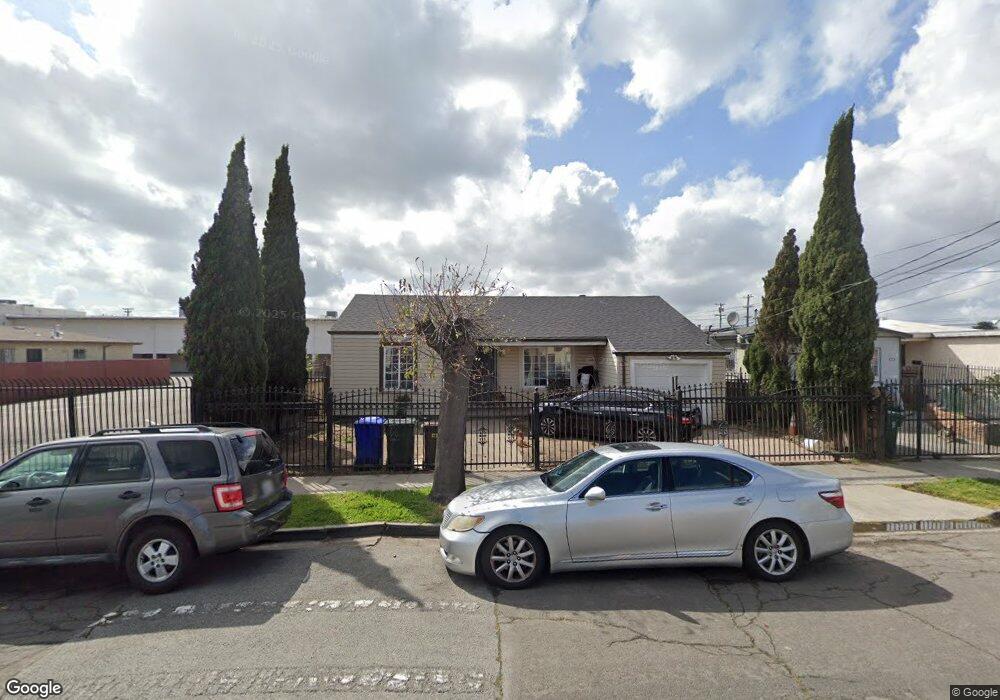
About This Home
This home is located at 129 S 16th St, Richmond, CA 94804 and is currently estimated at $461,824, approximately $569 per square foot. 129 S 16th St is a home located in Contra Costa County with nearby schools including Nystrom Elementary School, Lovonya DeJean Middle School, and John F. Kennedy High School.
Ownership History
We collect this data history from publicly available records. To have your information removed, we recommend requesting removal directly through your county’s website.
Purchase Details
Purchase Details
Purchase Details
Purchase Details
Purchase Details
Home Financials for this Owner
Home Financials are based on the most recent Mortgage that was taken out on this home.Purchase Details
Home Financials for this Owner
Home Financials are based on the most recent Mortgage that was taken out on this home.Purchase Details
Purchase Details
Home Financials for this Owner
Home Financials are based on the most recent Mortgage that was taken out on this home.Purchase Details
Home Financials for this Owner
Home Financials are based on the most recent Mortgage that was taken out on this home.Purchase Details
Purchase Details
Home Financials for this Owner
Home Financials are based on the most recent Mortgage that was taken out on this home.Purchase Details
Purchase Details
Home Financials for this Owner
Home Financials are based on the most recent Mortgage that was taken out on this home.Home Values in the Area
Average Home Value in this Area
Purchase History
We collect this data history from publicly available records. To have your information removed, we recommend requesting removal directly through your county’s website.
| Date | Buyer | Sale Price | Title Company |
|---|---|---|---|
| -- | None Available | ||
| -- | None Available | ||
| -- | None Available | ||
| -- | None Available | ||
| -- | None Available | ||
| -- | None Available | ||
| $90,000 | Cornerstone Title Company | ||
| $271,000 | Chicago Title | ||
| $228,100 | -- | ||
| $187,000 | Orange Coast Title | ||
| -- | Orange Coast Title | ||
| -- | Chicago Title Co | ||
| $138,000 | First American Title Guarant | ||
| -- | First American Title Guarant | ||
| -- | Fidelity National Title Co |
Mortgage History
We collect this data history from publicly available records. To have your information removed, we recommend requesting removal directly through your county’s website.
| Date | Status | Borrower | Loan Amount |
|---|---|---|---|
| Previous Owner | $72,000 | ||
| Previous Owner | $271,000 | ||
| Previous Owner | $68,000 | ||
| Previous Owner | $124,000 | ||
| Previous Owner | $83,318 |
Tax History
We collect this data history from publicly available records. To have your information removed, we recommend requesting removal directly through your county’s website.
| Year | Tax Paid | Tax Assessment Tax Assessment Total Assessment is a certain percentage of the fair market value that is determined by local assessors to be the total taxable value of land and additions on the property. | Land | Improvement |
|---|---|---|---|---|
| 2025 | $3,070 | $110,815 | $67,722 | $43,093 |
| 2024 | $3,004 | $108,644 | $66,395 | $42,249 |
| 2023 | $3,004 | $106,515 | $65,094 | $41,421 |
| 2022 | $2,914 | $104,427 | $63,818 | $40,609 |
| 2021 | $2,844 | $102,380 | $62,567 | $39,813 |
| 2019 | $2,659 | $99,345 | $60,712 | $38,633 |
| 2018 | $2,557 | $97,398 | $59,522 | $37,876 |
| 2017 | $2,480 | $95,489 | $58,355 | $37,134 |
| 2016 | $2,413 | $93,617 | $57,211 | $36,406 |
| 2015 | $2,353 | $92,212 | $56,352 | $35,860 |
| 2014 | $2,340 | $90,407 | $55,249 | $35,158 |
Map
- 138 S 17th St
- 1532 Chanslor Ave Unit T
- 145 S 20th St
- 10 12th St
- 100 12th St
- 102 12th St
- 2107 Ohio Ave
- 1719 Bissell Ave
- 125 12th St
- 1401 Bissell Ave
- 228 15th St
- 2031 Chanslor Ave
- 227 15th St
- 312 Marina Way
- 338 Village Ln
- 1502 Nevin Plaza
- 2317 Virginia Ave
- 628 S 17th St
- 467 Metro Walk Way
- 1917 Nevin Ave
Ask me questions while you tour the home.