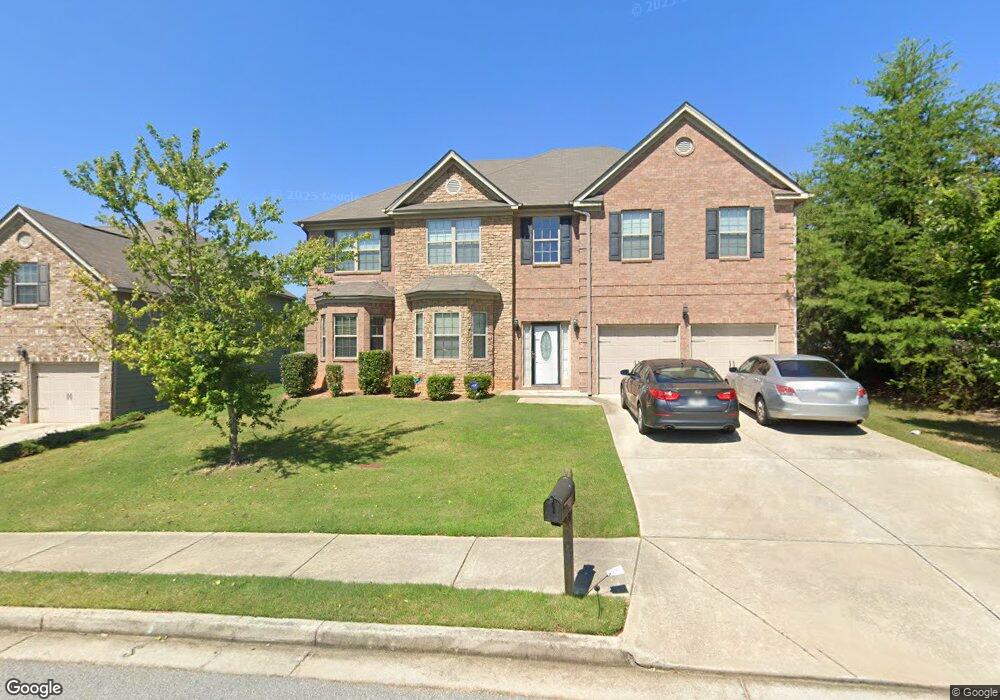
129 Saintvry Way Atlanta, GA 30349
Estimated Value: $423,000 - $505,000
5
Beds
5
Baths
4,364
Sq Ft
$105/Sq Ft
Est. Value
About This Home
This home is located at 129 Saintvry Way, Atlanta, GA 30349 and is currently estimated at $458,193, approximately $104 per square foot. 129 Saintvry Way is a home located in Fulton County with nearby schools including Cliftondale Elementary School, Renaissance Middle School, and Langston Hughes High School.
Ownership History
Date
Name
Owned For
Owner Type
Purchase Details
Closed on
May 4, 2018
Sold by
Wilkinson Franzine A
Bought by
Goins Nolanda L
Current Estimated Value
Home Financials for this Owner
Home Financials are based on the most recent Mortgage that was taken out on this home.
Original Mortgage
$243,016
Outstanding Balance
$210,295
Interest Rate
4.62%
Mortgage Type
FHA
Estimated Equity
$247,898
Purchase Details
Closed on
Jul 29, 2014
Sold by
Burgess Franzine A
Bought by
Wilkinson Franzine A and Fray Kanhai E
Purchase Details
Closed on
Oct 22, 2010
Sold by
Burgess Franzine A
Bought by
Kanhai Burgess Franzine A and Kanhai Fray
Purchase Details
Closed on
Apr 13, 2010
Sold by
Broadstone Partners Llc
Bought by
Roosevelt Builders Inc
Home Financials for this Owner
Home Financials are based on the most recent Mortgage that was taken out on this home.
Original Mortgage
$189,600
Interest Rate
4.94%
Create a Home Valuation Report for This Property
The Home Valuation Report is an in-depth analysis detailing your home's value as well as a comparison with similar homes in the area
Home Values in the Area
Average Home Value in this Area
Purchase History
| Date | Buyer | Sale Price | Title Company |
|---|---|---|---|
| Goins Nolanda L | $247,500 | -- | |
| Wilkinson Franzine A | -- | -- | |
| Kanhai Burgess Franzine A | -- | -- | |
| Burgess Franzine A | $239,500 | -- | |
| Roosevelt Builders Inc | $44,000 | -- |
Source: Public Records
Mortgage History
| Date | Status | Borrower | Loan Amount |
|---|---|---|---|
| Open | Goins Nolanda L | $243,016 | |
| Previous Owner | Roosevelt Builders Inc | $189,600 |
Source: Public Records
Tax History Compared to Growth
Tax History
| Year | Tax Paid | Tax Assessment Tax Assessment Total Assessment is a certain percentage of the fair market value that is determined by local assessors to be the total taxable value of land and additions on the property. | Land | Improvement |
|---|---|---|---|---|
| 2025 | $7,474 | $194,040 | $31,880 | $162,160 |
| 2023 | $5,336 | $189,040 | $25,640 | $163,400 |
| 2022 | $5,030 | $128,280 | $16,840 | $111,440 |
| 2021 | $4,984 | $124,520 | $16,360 | $108,160 |
| 2020 | $4,748 | $116,680 | $15,360 | $101,320 |
| 2019 | $3,910 | $99,000 | $14,520 | $84,480 |
| 2018 | $3,567 | $89,600 | $11,840 | $77,760 |
| 2017 | $3,078 | $75,520 | $11,400 | $64,120 |
| 2016 | $3,078 | $75,520 | $11,400 | $64,120 |
| 2015 | $3,087 | $75,520 | $11,400 | $64,120 |
| 2014 | $3,257 | $75,520 | $11,400 | $64,120 |
Source: Public Records
Map
Nearby Homes
- 204 Saintvry Path
- 3876 Margaux Dr
- 3912 Margaux Dr
- GRAYSON Plan at Butner Estates
- LYNNBROOK Plan at Butner Estates
- BELLVIEW Plan at Butner Estates
- WINDSOR Plan at Butner Estates
- WESTERLY Plan at Butner Estates
- 7314 Demeter Dr
- 7280 Wright Dr Unit 12
- 3830 Kastler Dr
- 3832 Kastler Dr
- 3835 Kastler Dr
- 7192 Linden Dr
- 7170 Linden Dr
- 6985 Butner Rd
- 7165 Linden Dr
- 129 Saintvry Way Unit 50
- 139 Saintvry Way
- 0 Saintvry Way Unit 8326271
- 0 Saintvry Way Unit 50
- 149 Saintvry Way
- 207 Saintvry Path
- 3963 Margaux Dr
- 3963 Margaux Dr Unit 3963
- 3963 Margaux Dr Unit 6
- 3963 Margaux Dr Unit 49
- 3959 Margaux Dr
- 3959 Margaux Dr Unit 48
- 217 Saintvry Path
- 159 Saintvry Way
- 3955 Margaux Dr
- 102 Saintvry Way
- 214 Saintvry Path
- 152 Saintvry Way
- 436 Margaux Way Unit 38
- 237 Saintvry Path Unit 63