Estimated Value: $247,000 - $461,000
3
Beds
2
Baths
1,552
Sq Ft
$217/Sq Ft
Est. Value
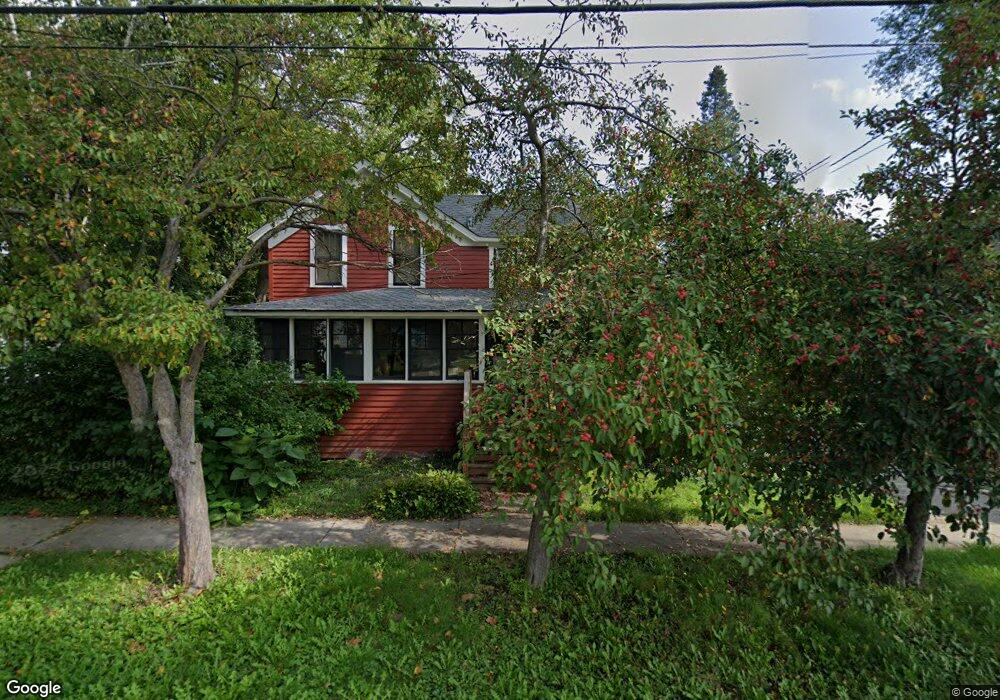
About This Home
This home is located at 129 Spring St, Cary, IL 60013 and is currently estimated at $336,372, approximately $216 per square foot. 129 Spring St is a home located in McHenry County with nearby schools including Briargate Elementary School, Cary Jr High School, and Cary-Grove High School.
Ownership History
Date
Name
Owned For
Owner Type
Purchase Details
Closed on
Jul 25, 2005
Sold by
Denk William C
Bought by
Arden Drucilla E
Current Estimated Value
Home Financials for this Owner
Home Financials are based on the most recent Mortgage that was taken out on this home.
Original Mortgage
$200,000
Outstanding Balance
$104,402
Interest Rate
5.66%
Mortgage Type
Fannie Mae Freddie Mac
Estimated Equity
$231,970
Purchase Details
Closed on
Feb 25, 2003
Sold by
Denk William C
Bought by
Denk William C
Home Financials for this Owner
Home Financials are based on the most recent Mortgage that was taken out on this home.
Original Mortgage
$45,370
Interest Rate
6.02%
Mortgage Type
Stand Alone Second
Purchase Details
Closed on
Nov 20, 2001
Sold by
Poll William and Poll Audrey L
Bought by
Denk William C
Home Financials for this Owner
Home Financials are based on the most recent Mortgage that was taken out on this home.
Original Mortgage
$168,000
Interest Rate
7.26%
Create a Home Valuation Report for This Property
The Home Valuation Report is an in-depth analysis detailing your home's value as well as a comparison with similar homes in the area
Home Values in the Area
Average Home Value in this Area
Purchase History
| Date | Buyer | Sale Price | Title Company |
|---|---|---|---|
| Arden Drucilla E | $262,000 | Pntn | |
| Denk William C | -- | -- | |
| Denk William C | $210,000 | -- |
Source: Public Records
Mortgage History
| Date | Status | Borrower | Loan Amount |
|---|---|---|---|
| Open | Arden Drucilla E | $200,000 | |
| Previous Owner | Denk William C | $45,370 | |
| Previous Owner | Denk William C | $168,000 | |
| Closed | Denk William C | $31,500 |
Source: Public Records
Tax History
| Year | Tax Paid | Tax Assessment Tax Assessment Total Assessment is a certain percentage of the fair market value that is determined by local assessors to be the total taxable value of land and additions on the property. | Land | Improvement |
|---|---|---|---|---|
| 2024 | $6,766 | $88,344 | $17,355 | $70,989 |
| 2023 | $6,573 | $79,013 | $15,522 | $63,491 |
| 2022 | $5,676 | $66,622 | $16,283 | $50,339 |
| 2021 | $5,395 | $62,067 | $15,170 | $46,897 |
| 2020 | $5,227 | $59,870 | $14,633 | $45,237 |
| 2019 | $5,114 | $57,303 | $14,006 | $43,297 |
| 2018 | $4,802 | $52,936 | $12,939 | $39,997 |
| 2017 | $4,695 | $49,869 | $12,189 | $37,680 |
| 2016 | $4,642 | $46,772 | $11,432 | $35,340 |
| 2013 | -- | $38,653 | $10,664 | $27,989 |
Source: Public Records
Map
Nearby Homes
- 321 Cold Spring St
- 341 Cold Spring St
- 331 Cold Spring St
- 371 Cold Spring St
- 128 E Main St
- 124 E Main St
- Lots 2,3,4 Northwest Hwy
- 112 Pearl St
- 330 Park Ave
- 349 Park Ave
- 603 W Main St
- 582 Arthur Dr
- 542 Cary Woods Cir
- 508 Crest Dr
- 258 Stonegate Rd
- 2016 Grove Ln
- 204 Country Commons Rd
- 842 Pin Oak Cir
- 946 Pin Oak Cir
- LOT 02 Three Oaks Rd
- 201 Spring St
- 123 Spring St
- 209 Spring St
- 117 Spring St
- 107 Spring St
- 104 Charlotte Place
- 204 Spring St Unit 21
- 204 Spring St Unit 7
- 204 Spring St Unit LL
- 219 Spring St
- 55 Cary St
- 110 Spring St
- 216 Spring St
- 51 Cary St
- 53 Cary St
- 112 Spring St
- 61 Cary St
- 49 Cary St
- 109 Cary St Unit E
- 109 Cary St Unit C
Your Personal Tour Guide
Ask me questions while you tour the home.